Overview
Modern businesses rely on web applications to drive revenue and customer trust, but teams often have no way of knowing a critical user flow is broken until customers start complaining. By then, the damage is done.
Synthetics addresses this by proactively simulating a customer's clickpath on a website or web application, reporting alerts before real users are impacted. Tests surface early insight into end user experience quality by tracking availability and latency metrics and flagging potential issues at threshold violation, instead of after the fact. As the designer owning LogicMonitor (LM) Websites, I drove the end-to-end design process, from discovery research and ideation through wireframing, user testing, and high-fidelity UI delivery, in close collaboration with PM and engineering. This project shipped.
Context
From a business perspective, Synthetics is an expansion of LM's existing website monitoring capability, which allows customers to periodically test website latency and availability from inside or outside their network. To broaden LM's monitoring capacity beyond basic checks, the team was designated to build website transactions: a vision feature that gives companies visibility into how their website's advanced features perform from their users' perspective.
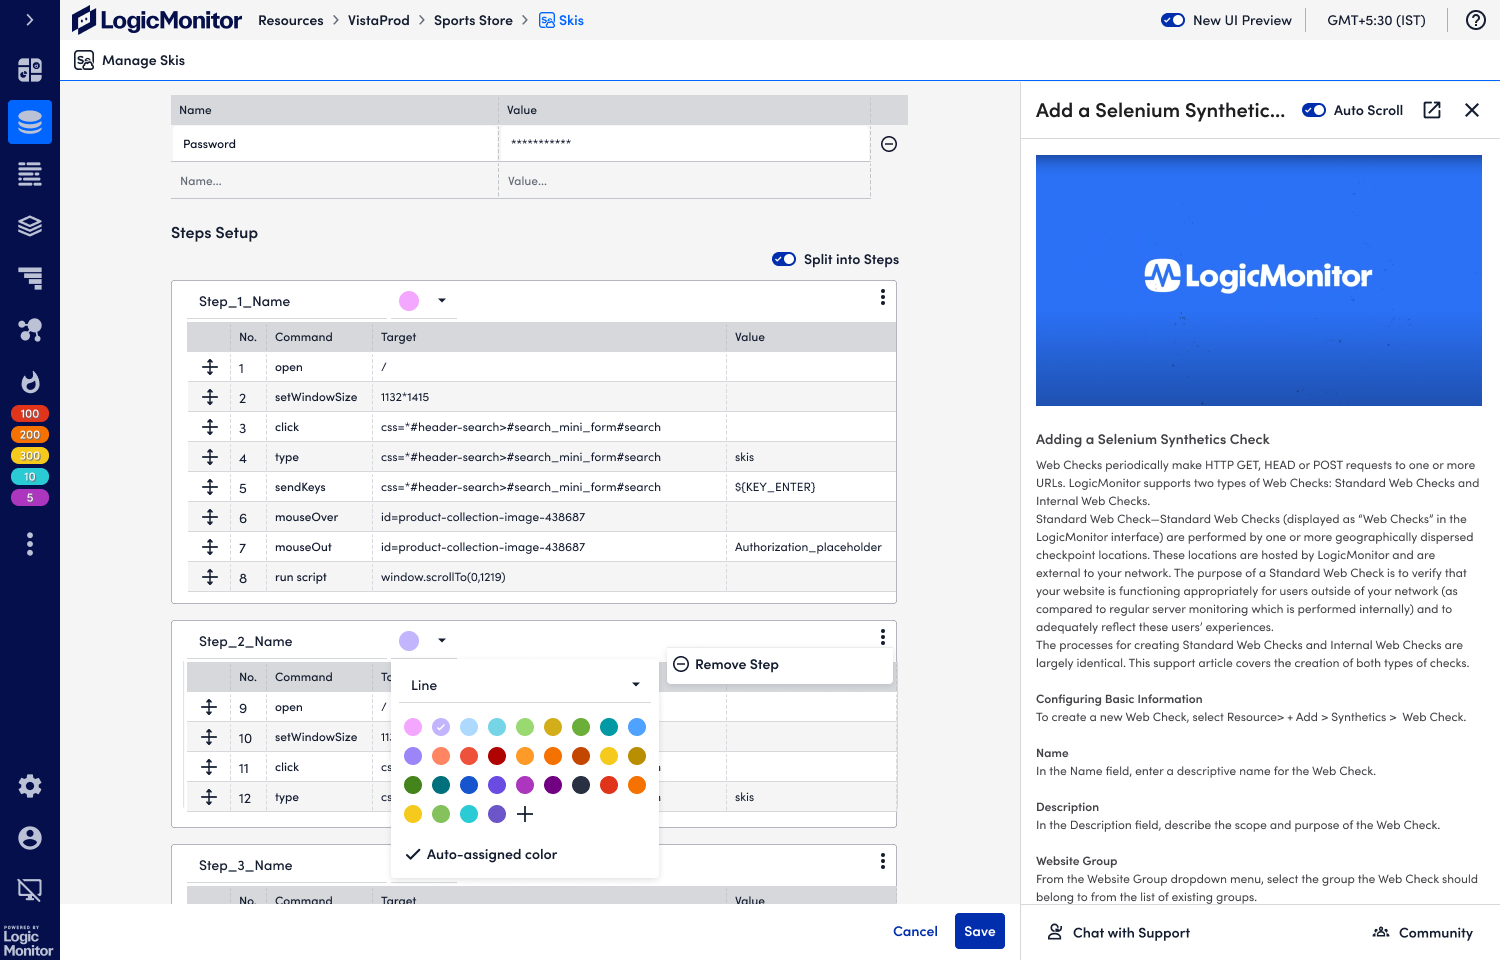
On the technical side, the product is integrated with Selenium IDE and Grid. Users record their clickpaths using the Selenium plugin, upload the script to LogicMonitor, deploy collectors, and receive alerts whenever an error is triggered by a threshold violation.
Prior to this project, LM already allowed users to receive alerts about an uploaded Selenium file as a resource. The critical gap was that there was no way for users to observe their website transactions through monitoring breakdown sections, leaving them unable to pinpoint exactly where in a flow something went wrong. The design goal for this product was therefore clear: enable users to know precisely where a click failed.
chevron_right
Read more about Selenium file or LM Synthetics
expand_less
Collapse Selenium file or LM Synthetics
Synthetics is an important and envision feature to LogicMonitor (LM) that complements LM traditional monitoring of core website vitals into uptime and availability. By simulating scripted web checks, LM Synthetics helps users to observe the transaction performance of their hosted webpages, receives alerts on breakdown sections before they caused negative impacts, and optimize websites health and improve end-user experience.
LM Synthetics monitoring leverages Selenium—an open access, open source browser automation and scripting tool—to send Synthetics data to LogicMonitor. Selenium plugin script down end users' action on the web. Uploading the downloaded script (.side) to LM, users are able to monitor and observe simulated customer experience with their websites, before those problems led to substantial impacts. More could be found via this link.
Discovery
Kicking this off with Paige (PM) and JC (Lead engineer), I had a preliminary picture about the requests and goals we want to achieve. Through Synthetics, we want to empower our users by making it -
More powerful
Perform web checks with more complex requests than URL status check
More efficient
Reduce users' manual efforts to set up a set of web checks, and minimize their MTTR to replicate a web browsers' actions and troubleshoot
More granular
Automatically provide meaningful metrics at step level and visualize its performance
More integrated
Fit website monitoring into other LM monitoring tools such as Resources and Dashboard for a unified platform experience
With the delivery of this feature, we want to achieve a series of business goals:
Expand revenue and bill for the usage of this feature
Reduce churn rate by providing complex website monitoring functions and eliminating lost deals
Boost the provision of an observability platform
Problems to Solve:
1. Websites are hard to create: Most modern sites require authentication – we require users to script out the checks for these sites, which is cumbersome and always followed by the question "Do you offer professional services"? We need to make it easier for customers to create web/synthetic checks for modern sites.
2. Websites can't be used throughout the rest of LM. Websites cannot be used in services, dashboards, reports, and they show up differently in Alerts, Alert Rules, etc. We need to make it so that Websites can be used consistently throughout the rest of LM, just like other resource types – so customers can actually get value from them.
3. Data monitored isn't granular enough - In many cases, customers want to see the time for each simulated action (eg add to cart, checkout) vs a cumulative tested time for the whole series of operations. This gives them more insight into where issues are occurring. We need to make sure that the data we are reporting for Websites is actually useful for customers in achieving their goals (preventing downtime, identifying issues, optimizing performance).
Use Cases
The user can break out their Selenium test file into arbitrary steps, i.e. they have the ability to designate what is considered a "step".
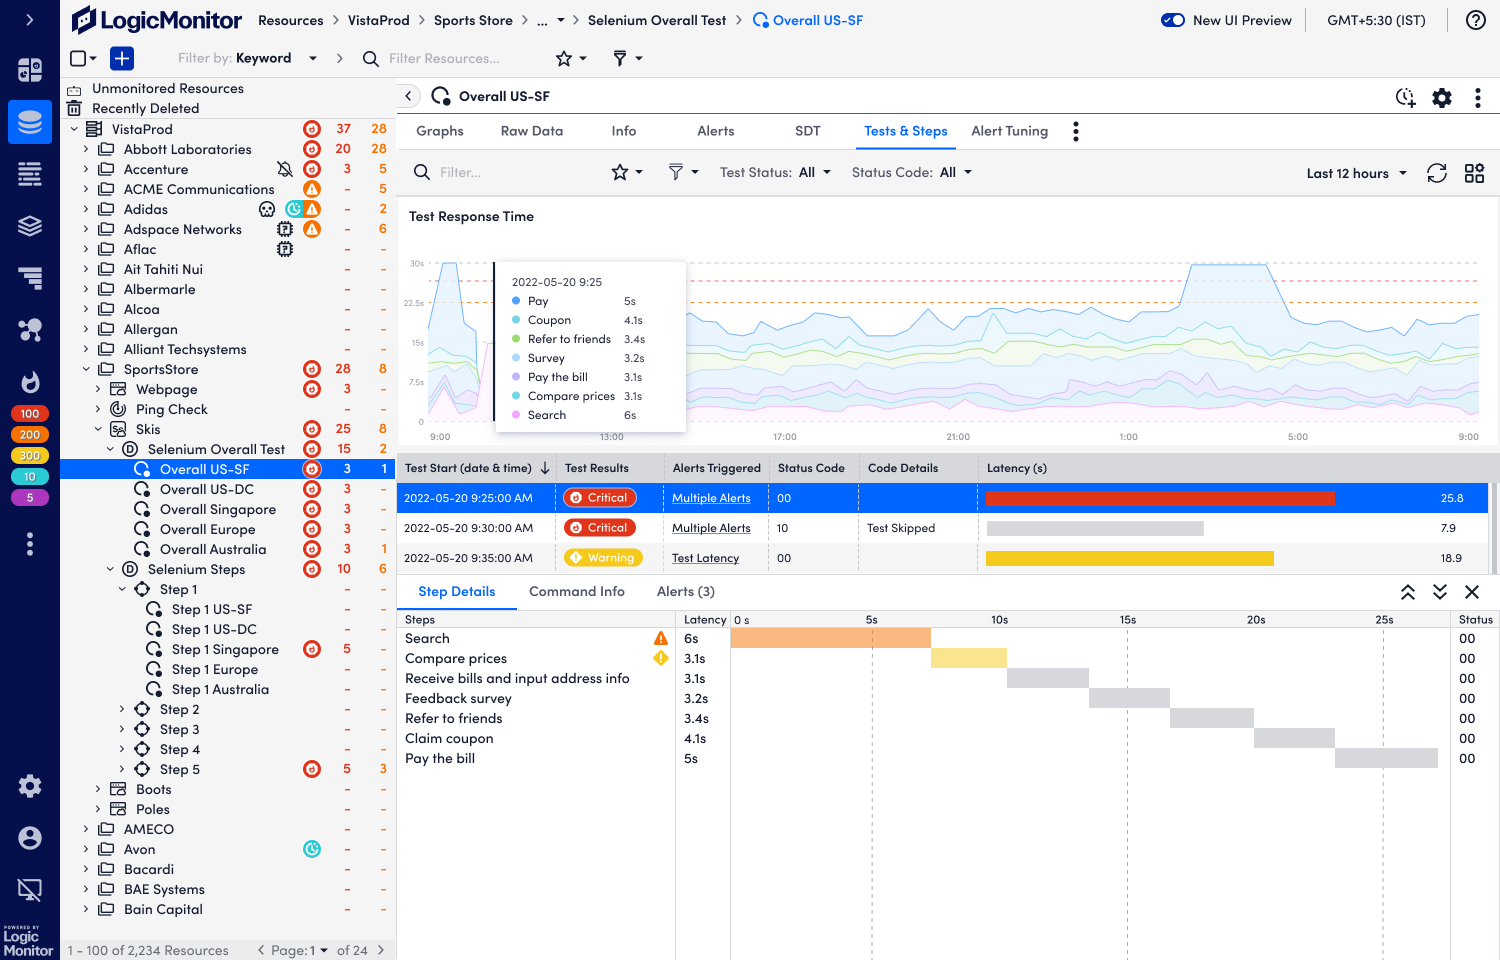
The user can see the latency information of each step
The user can alert on criteria for each step
Any errors would show the step on which it was encountered
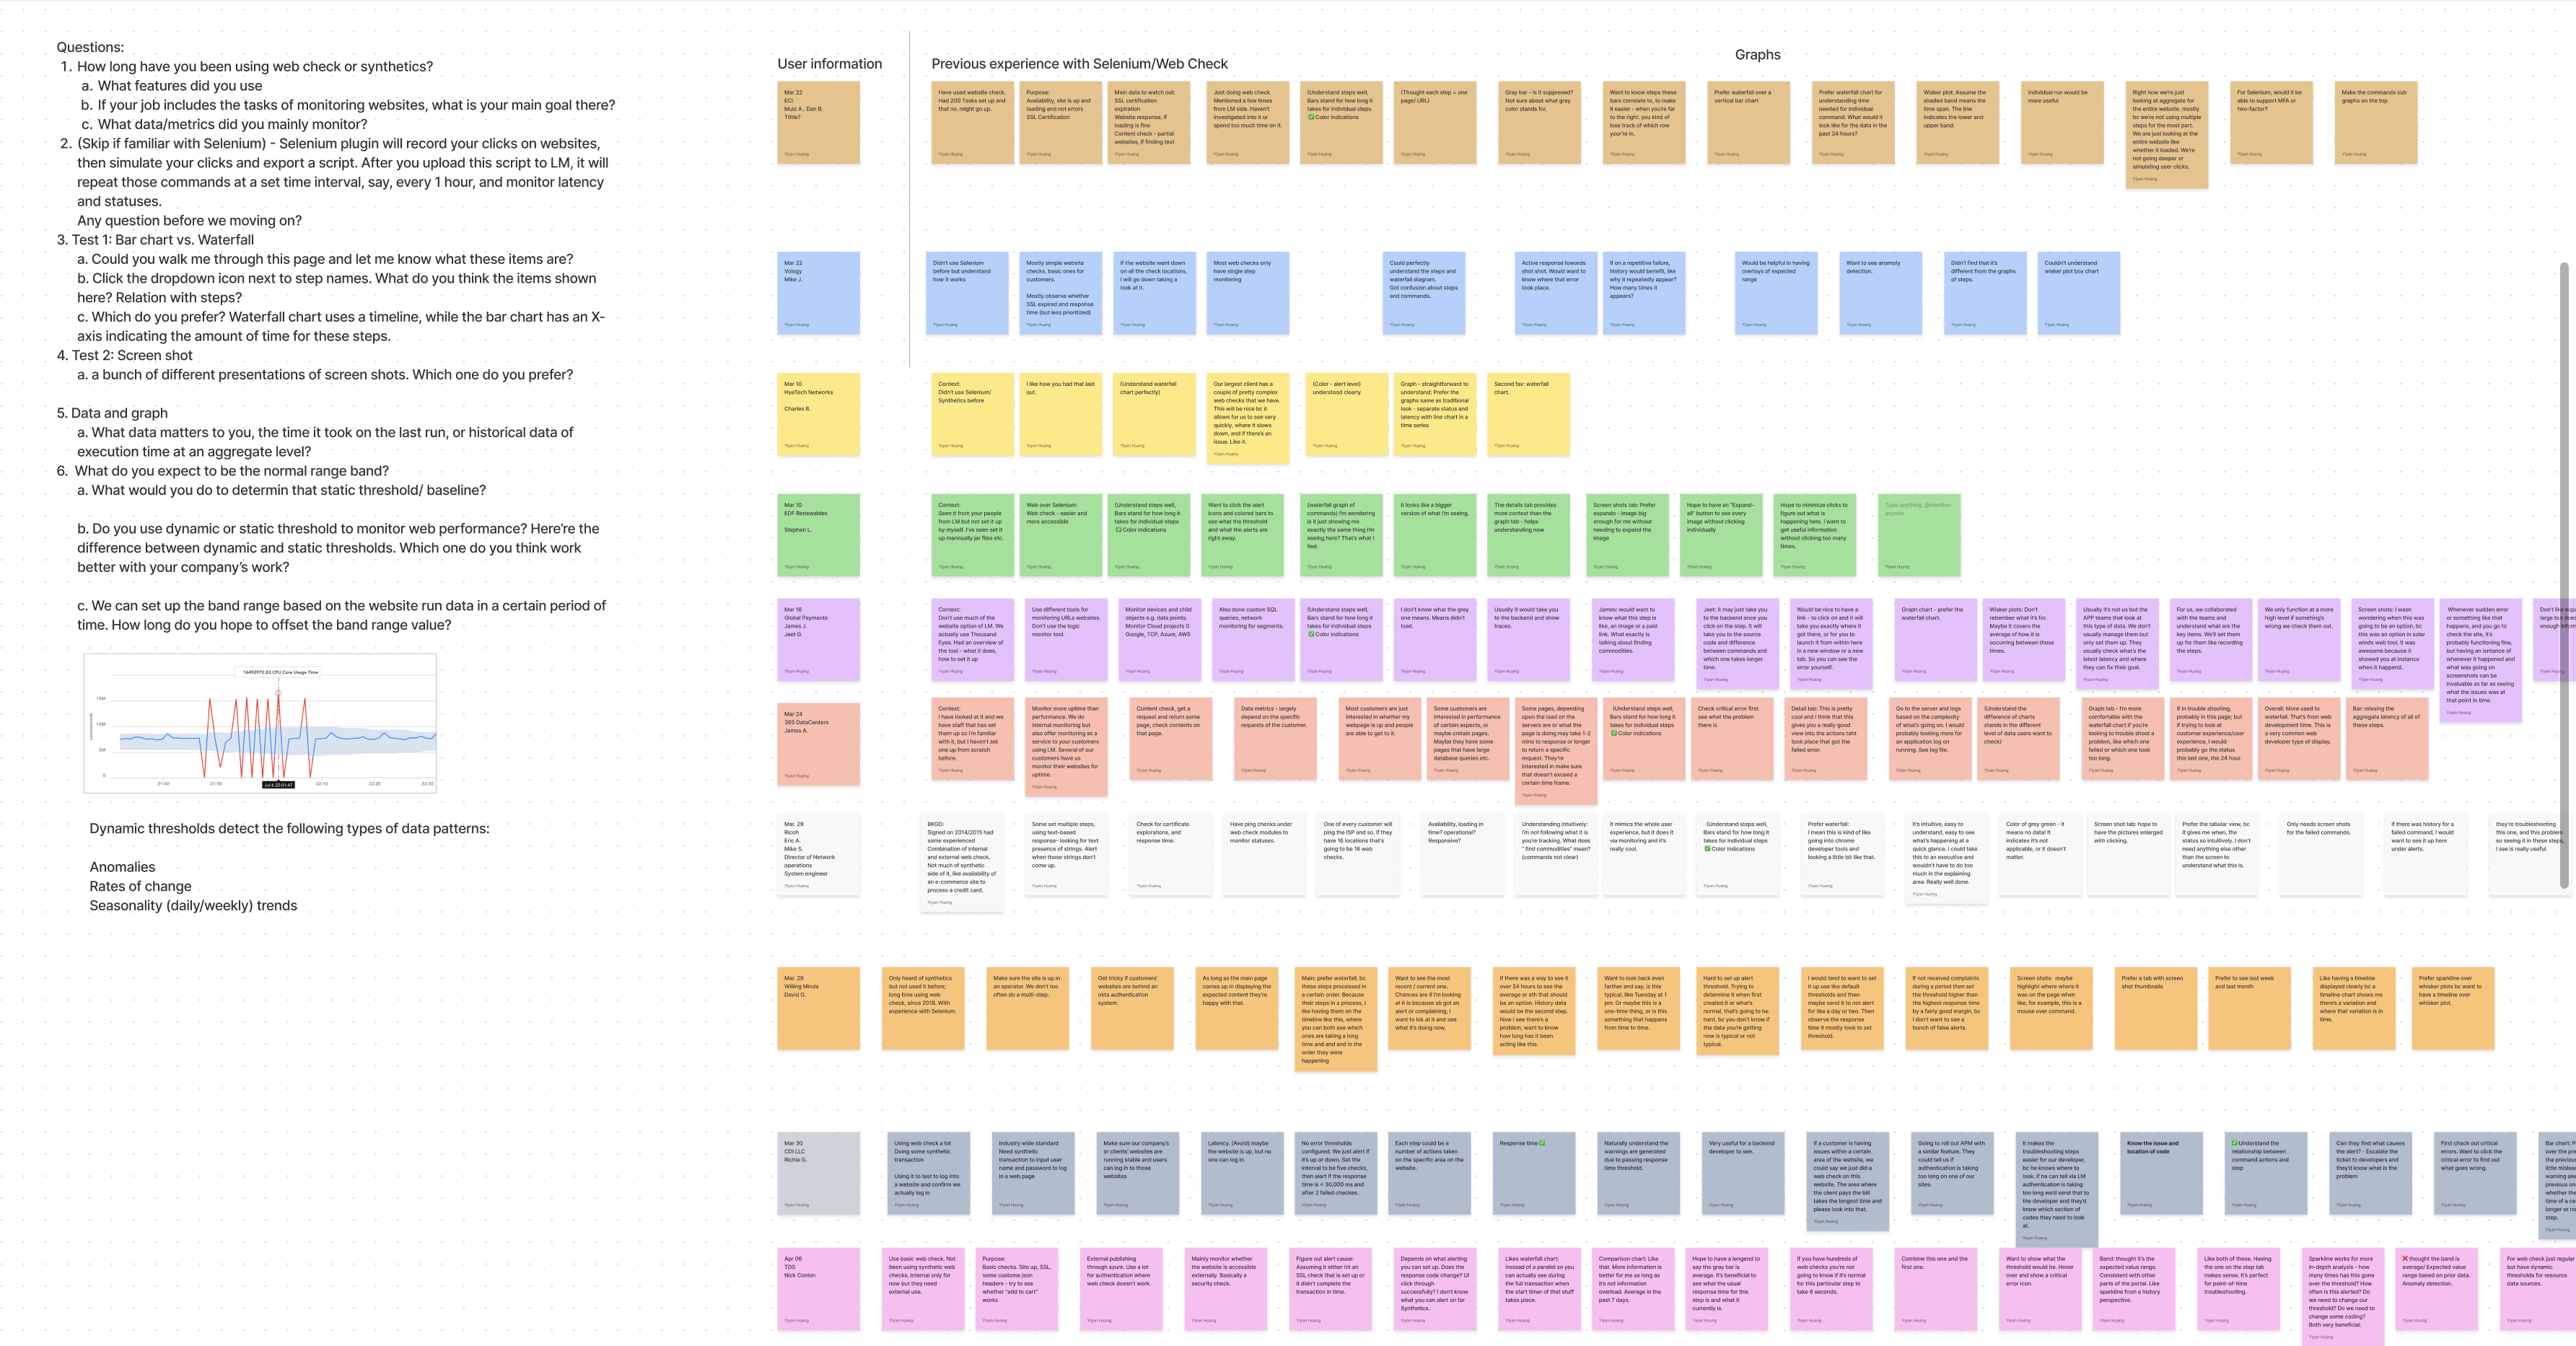
Semi-structured User Interviews
Working together with PM and leading engineers as a mission team on this visionary project, we first need to understand users' goals and challenges encountered. Wearing multiple hats in LM, I started with foundational research with our customers. Interviewing 10 enterprise companies inquiring about monitoring goals, feedbacks about drafts of visualizations and challenges. Based on research results and working together with PM, we came up with the use cases/solutions we aim to achieve:
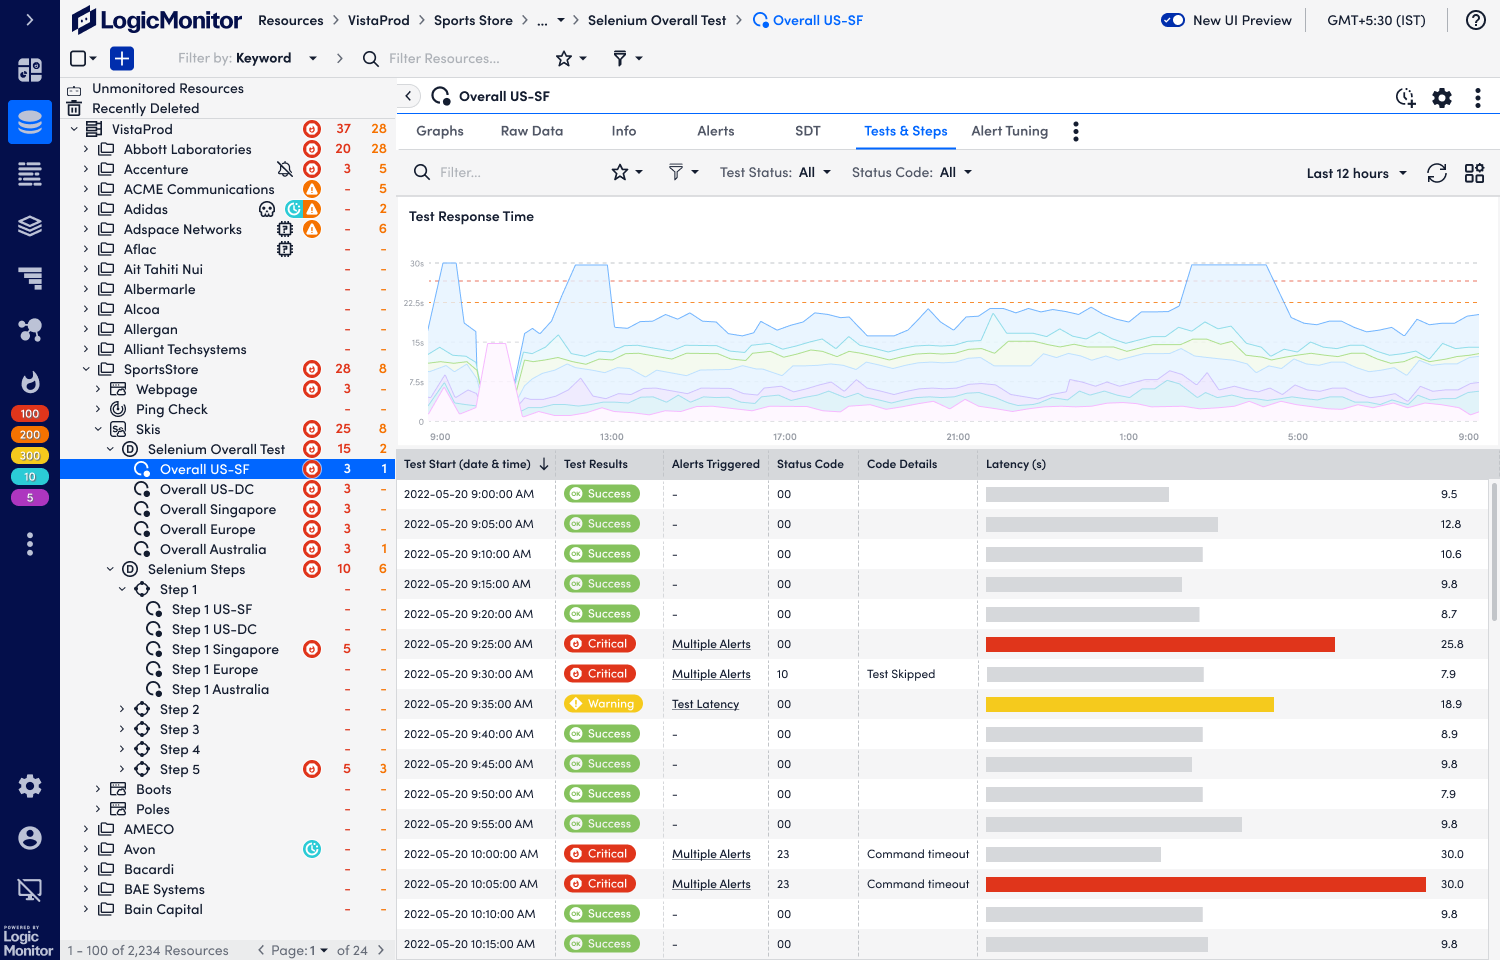
1. The user needs to be able to see the status of their Synthetic checks per test, per step, and per location.
2. The user needs to be able to set alert thresholds for multiple synthetic checks.
3. The user wants to be able to see at a glance what portion of the latency is attributed to each step.