Overview
LogicMonitor is an infrastructure observability platform for System Engineers.
System engineers use LogicMonitor to monitor IT infrastructure metrics and receive alerts when the data went abnormal. But receiving alerts is only the starting point of troubleshooting. After that most teams still lose valuable time manually gathering logs and system data to help locate the root cause, before investing more time and attempts to fix the issue. Diagnostics and Remediation is the tool to streamline the process and expedite troubleshooting.
The project starts from a customer request from the field and a product request document from Ed (PM). It highlighted three main use cases where the product should meet: administrative security control with role-based access, enabling users to deploy scripts of diagnostics and remediation, and automated diagnostics and remediation at the time of alerts. In the following five months, I worked with Ed to reframe the design requirements in line with user habits and implemented designs phase by phase. By the time it was shipped, users are able to install diagnostics and remediation scripts easily, manually run them and view results, and view a complete record of output data documented when they stepped away from the tools. It was well received by our users of system engineers, and achieved business success.

50%+
Increased account adoption in one month

Top 5
Largest customers subscribed the product

30%
Reduction of the Mean Time to Repair (MTTR)

Degree of helpfulness (5 being most helpful)
cHALLENGES
Before diving into high-fidelity execution, I identified several strategic hurdles that required resolution to ensure a meaningful design outcome.

Unclear user problem and needs
The initial scope on PRD focused narrowly on reactive troubleshooting (triggered by alerts), but we have no idea how it would fit users' troubleshooting journey and accommodate to users' habits. Details like users' frictions and value proposition are missing too.

Technical constraints and limited resources
As a pilot project, there are limited front-end resources and a condensed timeline to prove product value. It was imperative to define a lean MVP and phase design plans.

Ambiguity before design mockups
A significant disconnect existed between the high-level product documentation and concrete design solutions. As a product that could involve changes on multiple products, the execution team is not aligned with where the changes land.
Design Process
Bridging the gap between PRD and high-fi mockups: Navigating and exploring design opportunities
To address these challenges, I initiated a contextual interview with 5 users and 2 meetings with subject matter experts to understand users' troubleshooting experience. It will help clarify how the product will help users to speed up their troubleshooting journey and whether they found the feature useful to ensure the investment is worthwhile.
Following that, I led a workshop on user story mapping with PM and Kevin (Principal Designer on Edwin, LM's AI agent product), for clarifying the end-to-end user flows and specific changes on products. To make sure we could meet the tight timeline and showcasing values for this pilot projects, I worked with Ed to formulate design phases of the whole user flow and align with engineers on a weekly cadence. It realized actual agile development and make sure the product is delivered in time.
After the high-level flows are clarified and aligned with engineers, I started quick prototyping on the flows and layout, followed by high-fidelity mockup delivery and usability testing.

chevron_right

AI tools speed up my design process. Click to view more about how it works.
expand_less
Collapse this section of AI assistance
When working on scalable tools which could be helpful in multiple scenarios and when users share part of the creativity of using them, I was always asked: can you give me a more specific example how it can be helpful in troubleshooting?
Coming from a designer background, I turned to my engineer teammates for these questions. But due to the time zone difference and a tight timeline, I used LLM tools instead to run a quick research on online community and compile a very detailed use case. I found it super helpful too when generating diagrams with mock data to prove that the data visualization and interaction helps users to spot the anomaly and dive into troubleshooting. In the real world, a detailed diagram with mock data is way more persuasive than a grey box reading "diagram".
I prompted ChatGPT with the framework of infrastructure troubleshooting stages based on our research, and required it to refer to online community discussion on Reddit and LM community. With a couple of attempts and editing, I have a very detailed user story to share with stakeholders to show that diagnostics is helpful. It helps a lot when presenting my designs to the whole product team and I received great feedback from the team.
Salvio, a Systems Engineer responsible for keeping infrastructure up and remediating issues, rolled out Diagnostics and Remediation Services across our environment. One of the main tasks is ensuring applications perform smoothly and that cpuBusyPercent stays below 95%. To speed up troubleshooting, Salvio set up automated diagnostics so that whenever a high CPUBusyPercent alert triggers, LM automatically collects the top CPU-consuming processes. From there, if a spike is caused by a runaway application, the system can trigger an automated remediation workflow to restart that process.

Discovery
Here are the research findings and how they translate into product decisions:

Research

Decision
Users took both proactive and reactive troubleshooting paths.
We will provide access to Diagnostics and Remediation on Resources and Alerts.
Depending on the actual scenarios, users choose different diagnostics and remediation scripts.
The product need to be flexible to meet users' different use scenarios.
Users have concerns about how the tool will actually help them save the efforts. They are concerned that they may end up in the server regardless.
Users would make multiple efforts to find out root causes. Users should be able to run multiple Diagnostics and Remediation.
What brings values to users is a history record of data at the time of alert.
Being able to view the history record is also important for users to troubleshoot and should be included in the initial product release.
Sentiment score of its value proposition. Score of helpfulness: 4.5 / 5 (5 being most helpful)
It was a helpful tool for users with potential business development opportunities.
With the research insights, the design goals I need to achieve became clear too: it needs to be flexible, scalable and intuitive. To measure the success of design, I listed out the metrics from usability testing: task success rate, easiness to complete, and degree of helpfulness.
User Story Mapping
Further closing the gap between research and design solutions
I led a workshop session with Ed (PM) and Kevin (Principal desinger on Edwin AI) to align on detailed use cases and end-to-end user flow. We started with three top-level user needs and brainstormed the end-to-end user steps and tasks. It clearly maps out the products where we need to make changes. While working on this, the team are gradually clear about the interaction details we need to pay attention to at each step. The challenges became clearer and specific now.
As a LM Administrator who cares about keeping my infrastructure secure and performance, I need the ability to manage the availability and access to automated Diagnostics & Remediation at a very granular level to limit unintentional or destructive commands running on my environment. I need control over which resources are available for automated scripts.
Configure automated diagnostics and remediation
As a System Engineer, I need to be able to select out-of-the-box diagnostic and remediation scripts that can be run against my resources to pull diagnostic data, and associate those scripts to specified resources, instances, and datapoints, so when those datapoint alert thresholds are met, my scripts will automatically run.
Run and view diagnostics and remediation
As a System Engineer, I need to be able to see automated diagnostic data as part of my troubleshooting workflow. This workflow includes the LM alert details, LM Logs, and also as enriched alert details in tickets we create in third-party ITSM platforms. I will need to see a history of diagnostic data associated to alerts that have triggered in the past.
The design requests on security control and configuration are straightforward and clear after the workshop. For the following exploration and delivery part, I will mostly focus on sharing design decisions made on running and viewing diagnostics and remediation, and automated diagnostics and remediation.
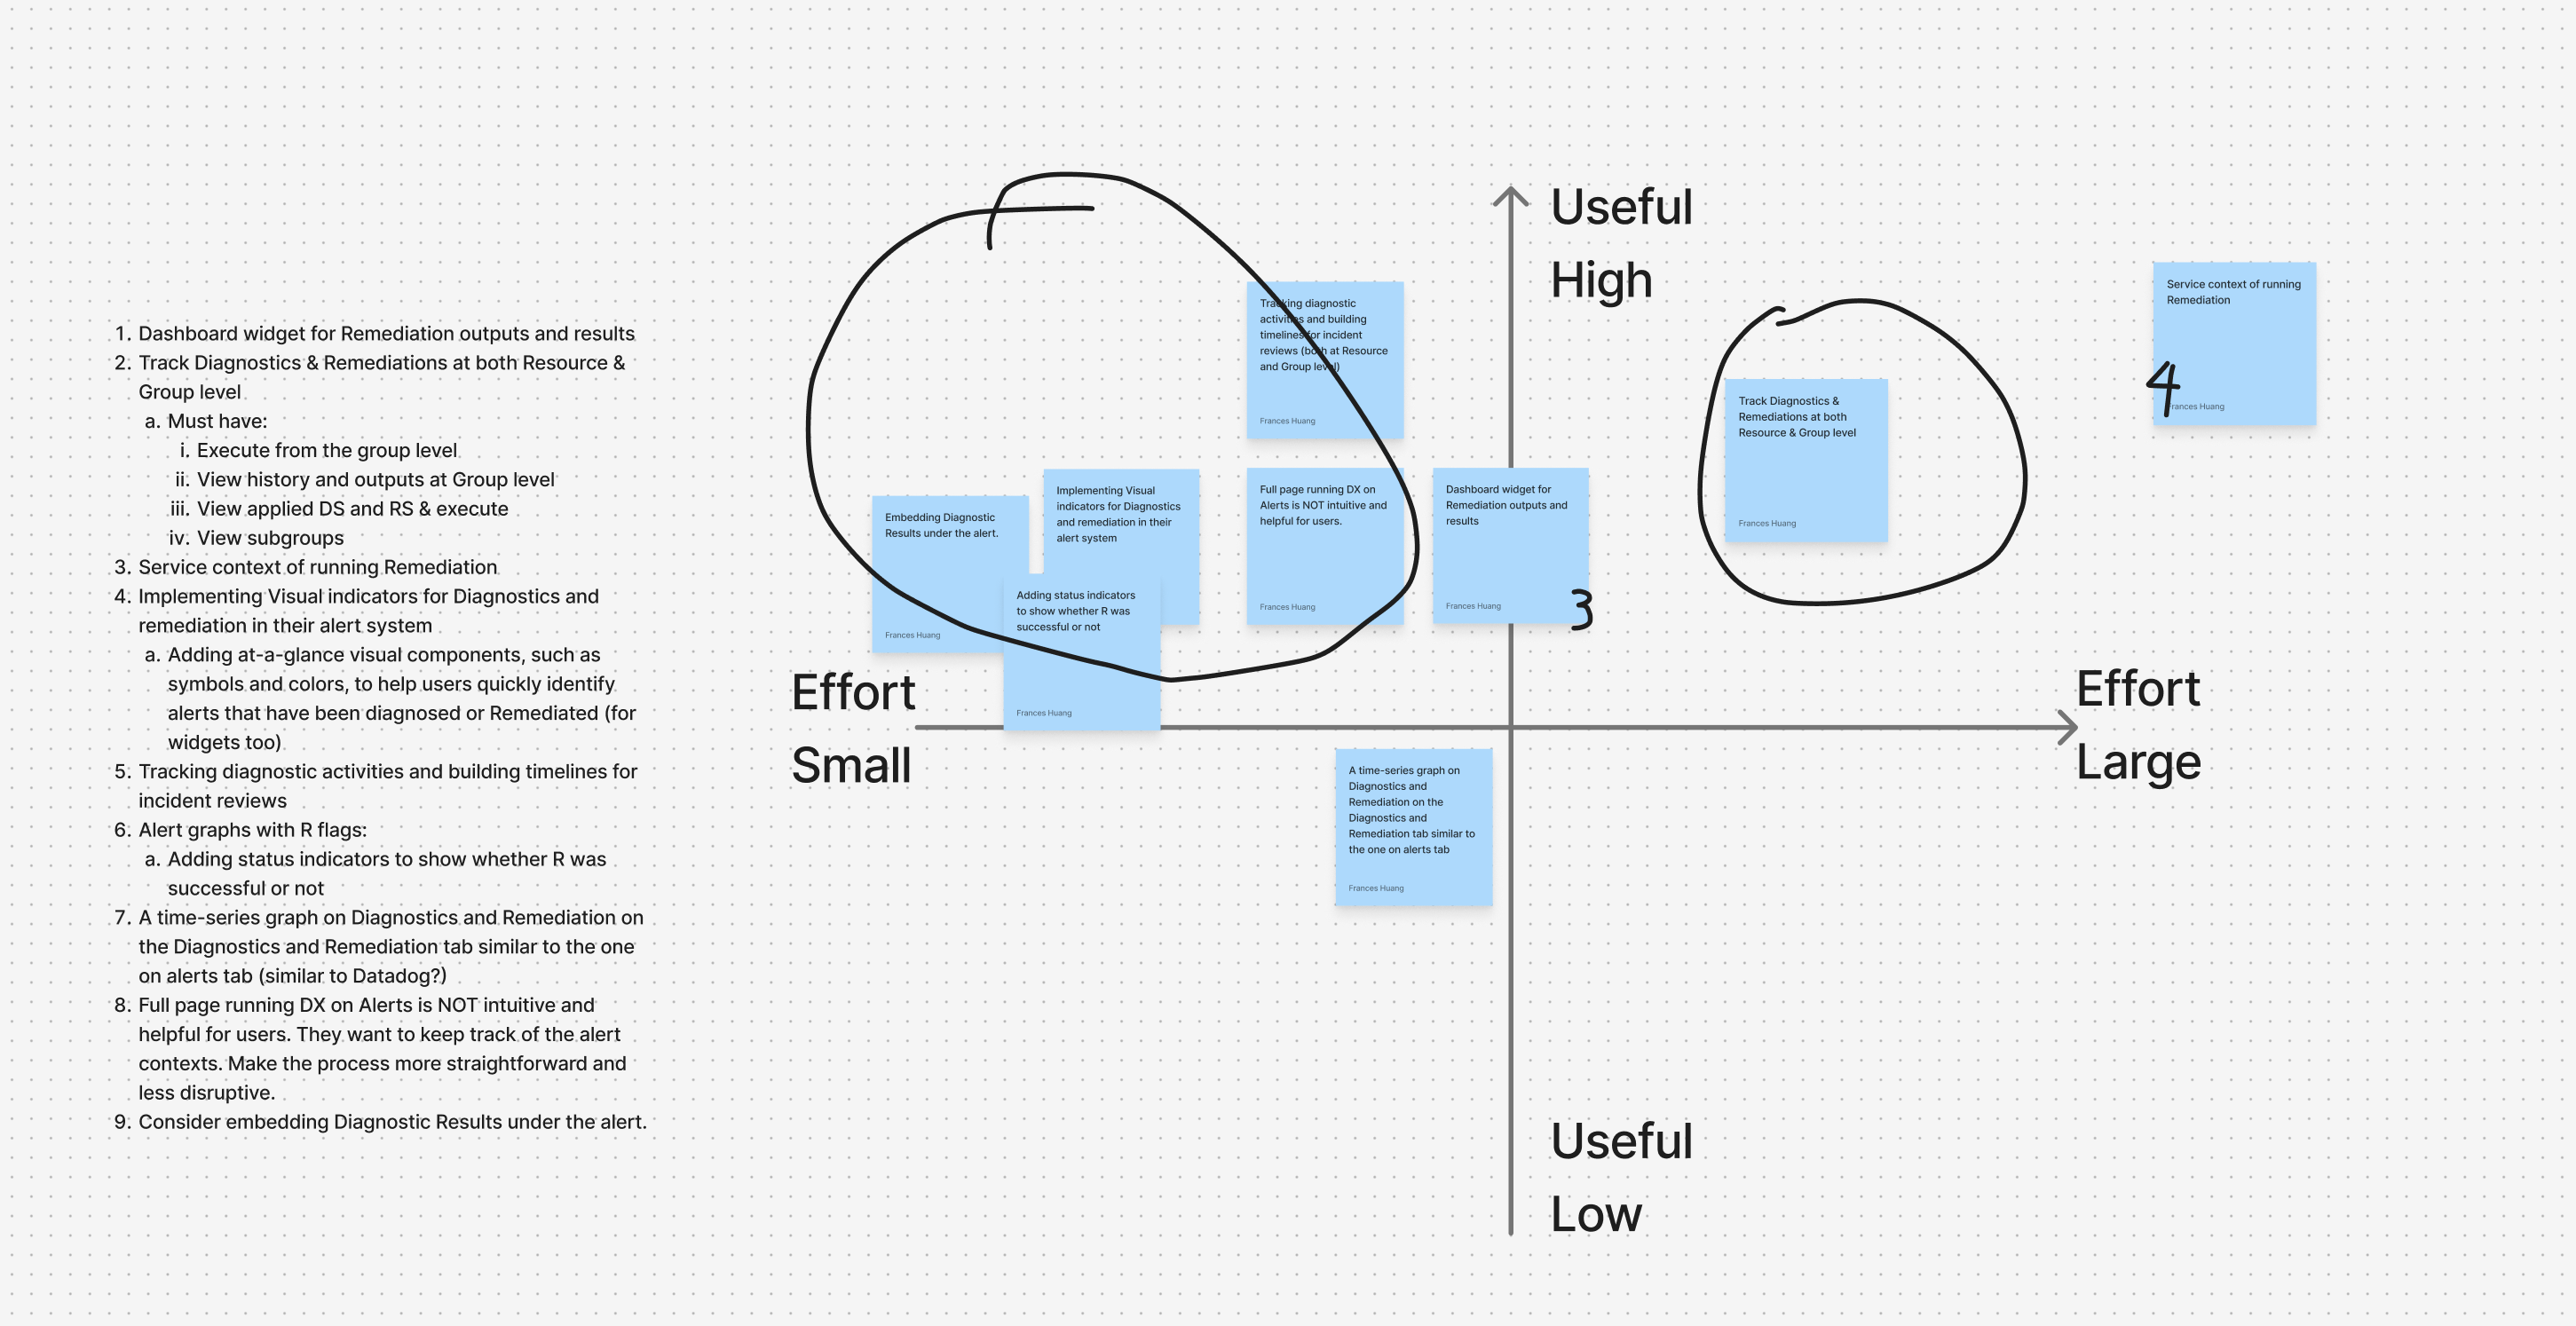
Ideation
Lo-fidelity mockups map out the high-level flows and help clear technical constraints with PMs and engineers.
There are 3 major questions I aim to address with a lo-fi rapid mockups:
How might we enable users to select, run and view outputs of DiagnosticSources and RemediationSources?
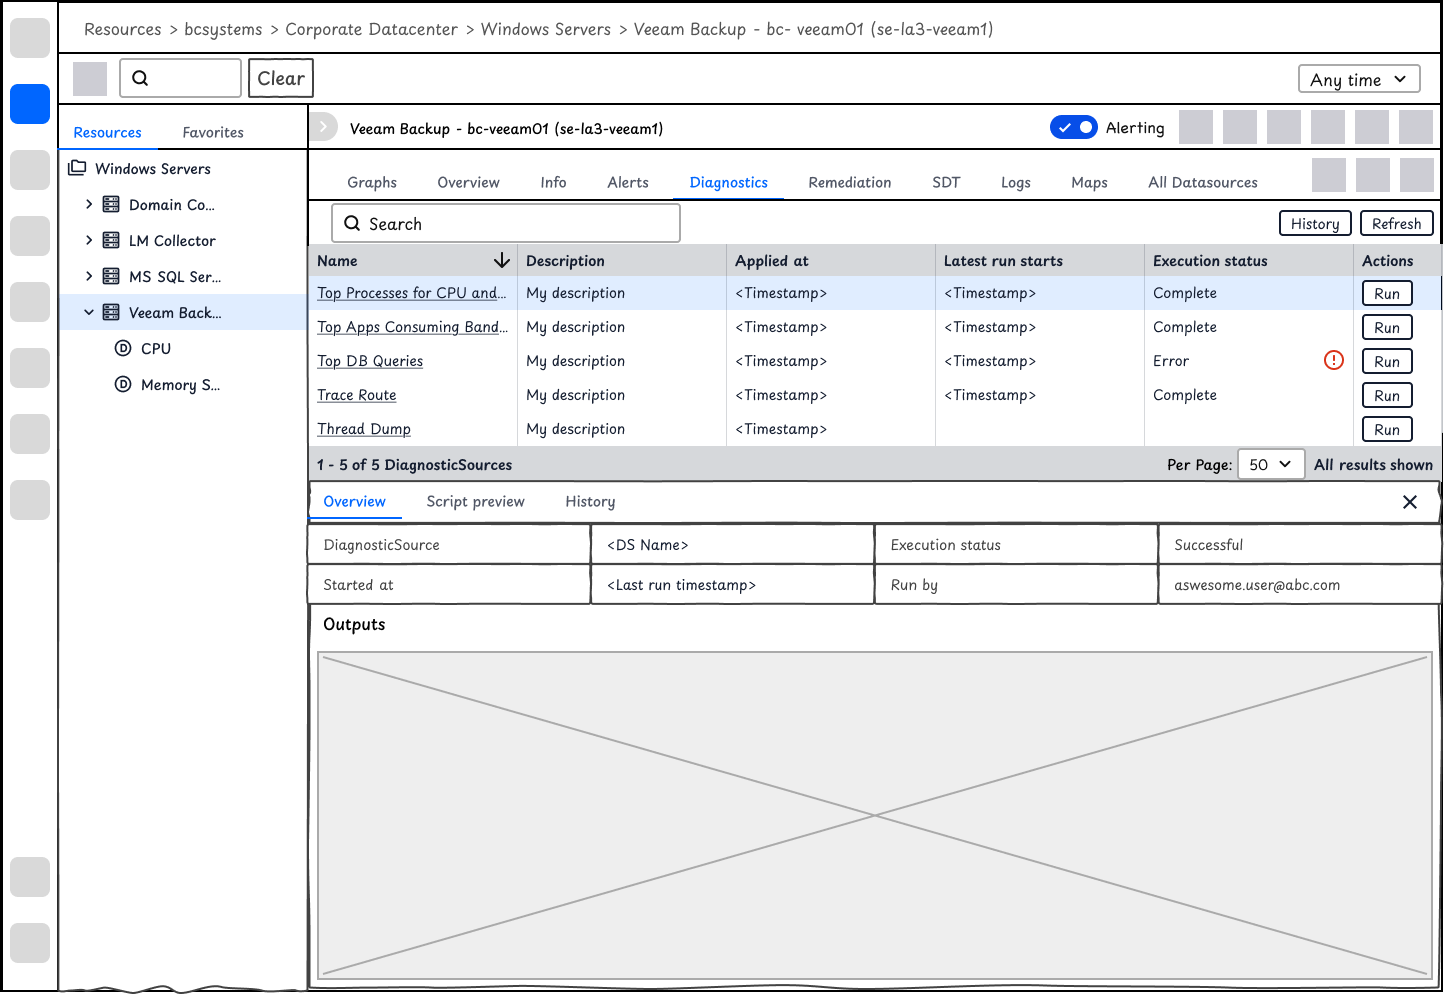
At the device level, users may view a list of DiagnosticSources and RemediationSources. It will allow users to view and execute scripts with one click, and also show the latest execution results.
After aligning with the team, we are not able to predict what scripts users will run and what the results are. Instead of using table or other data visualization, I use a window to display the raw text outputs.
Users expressed security control concerns during the interview. To make sure users understand the DiagnosticSource to be executed, users will be able to view the script first.
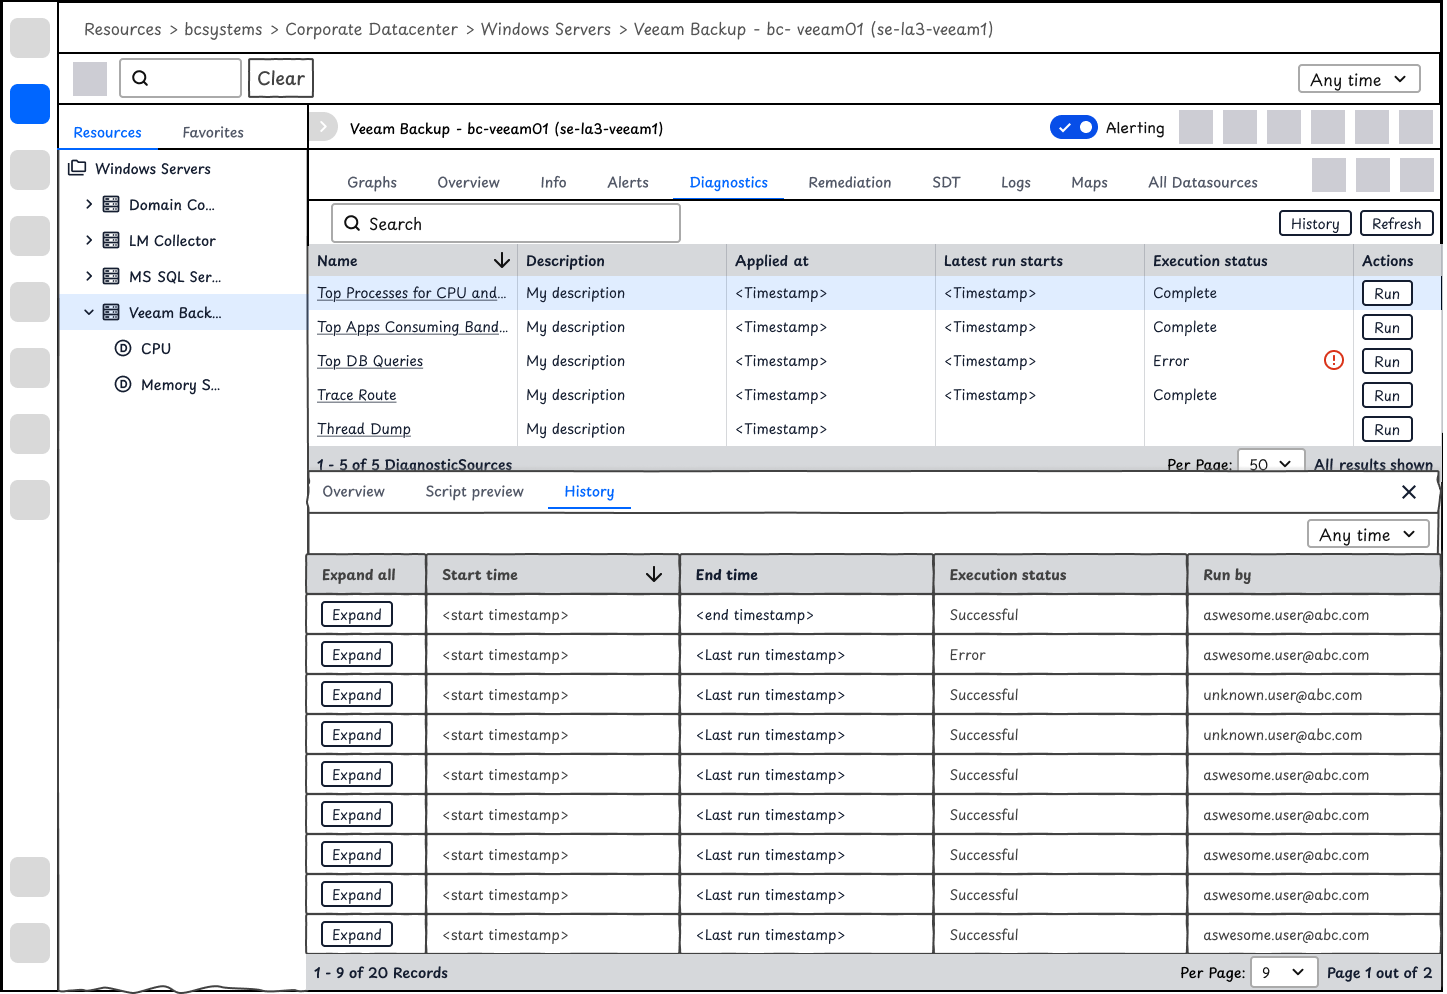
Given that it's a complex interface on Resources and that users expect to compare history record, I used expanded table for displaying history outputs.
chevron_right
I also explored some other options. Click here if you would like to view.
expand_less
Collapse this section
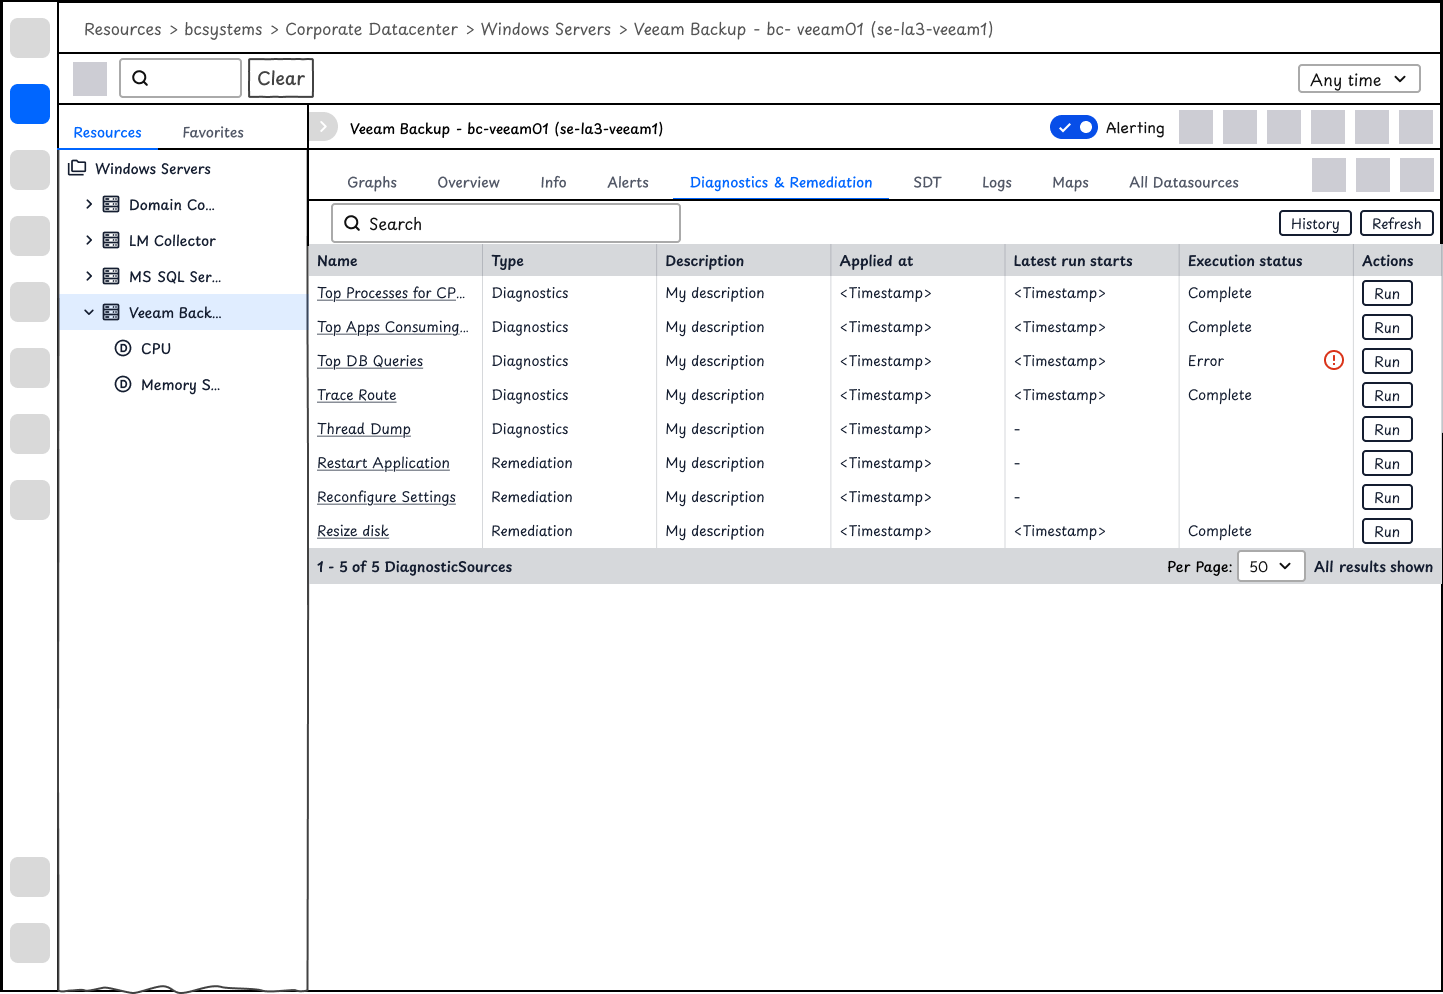
The tabs for diagnostics and remediation are separate based on SME's feedback that they would like to have separate access control for diagnostics and remediation.
I also explored options where the data is better visualized so that users could track the change over history or view the anomaly immediately. But after aligning with Engineers and PM, we cannot predict the scripts user install. The output data might not be numerical.
How might we enable users to run and view DiagnosticSources outputs at the time of alerts?
For the reactive troubleshooting flow, I compared 2 design options for displaying the diagnostics outputs on Alert. We move forward with Design Option 2.
Option 1 - Less dev efforts
It will display a record of DiagnosticSource outputs on this Resource. It will look similar to the history tab on resources. It requires less efforts but will ask users to spend extra time filtering out the diagnostic outputs at the time of alert. It's difficult for users to manually run a DiagnosticSource without leaving the current interface too.
✅ Option 2 - Display of outputs at the time of alerts
When users dive deep in an alert, they want to view the diagnostic outputs directly relevant to the alert context. Option 2 focuses on showing the outputs so that users will access those information immediately. On top of that, they may manually run diagnostics with a click to see the current results.
How might we help users understand whether the RemediationSources work or not?
Instead of copying the display of DiagnosticSource outputs, I'd argue that outputs of RemediationSources are less important than that of Diagnostics. Instead users care about whether the remediation fixes the issue. While talking to engineers, there are no convenient ways of validating whether it works or not. Instead, I propose that we could visualize diagnostic actions on the alert chart. By observing the attempts, users will understand whether the actions work or not.
The ideation was developed along with the design and development phases of this project. After aligning with stakeholders, I delivered the high-fidelity designs.
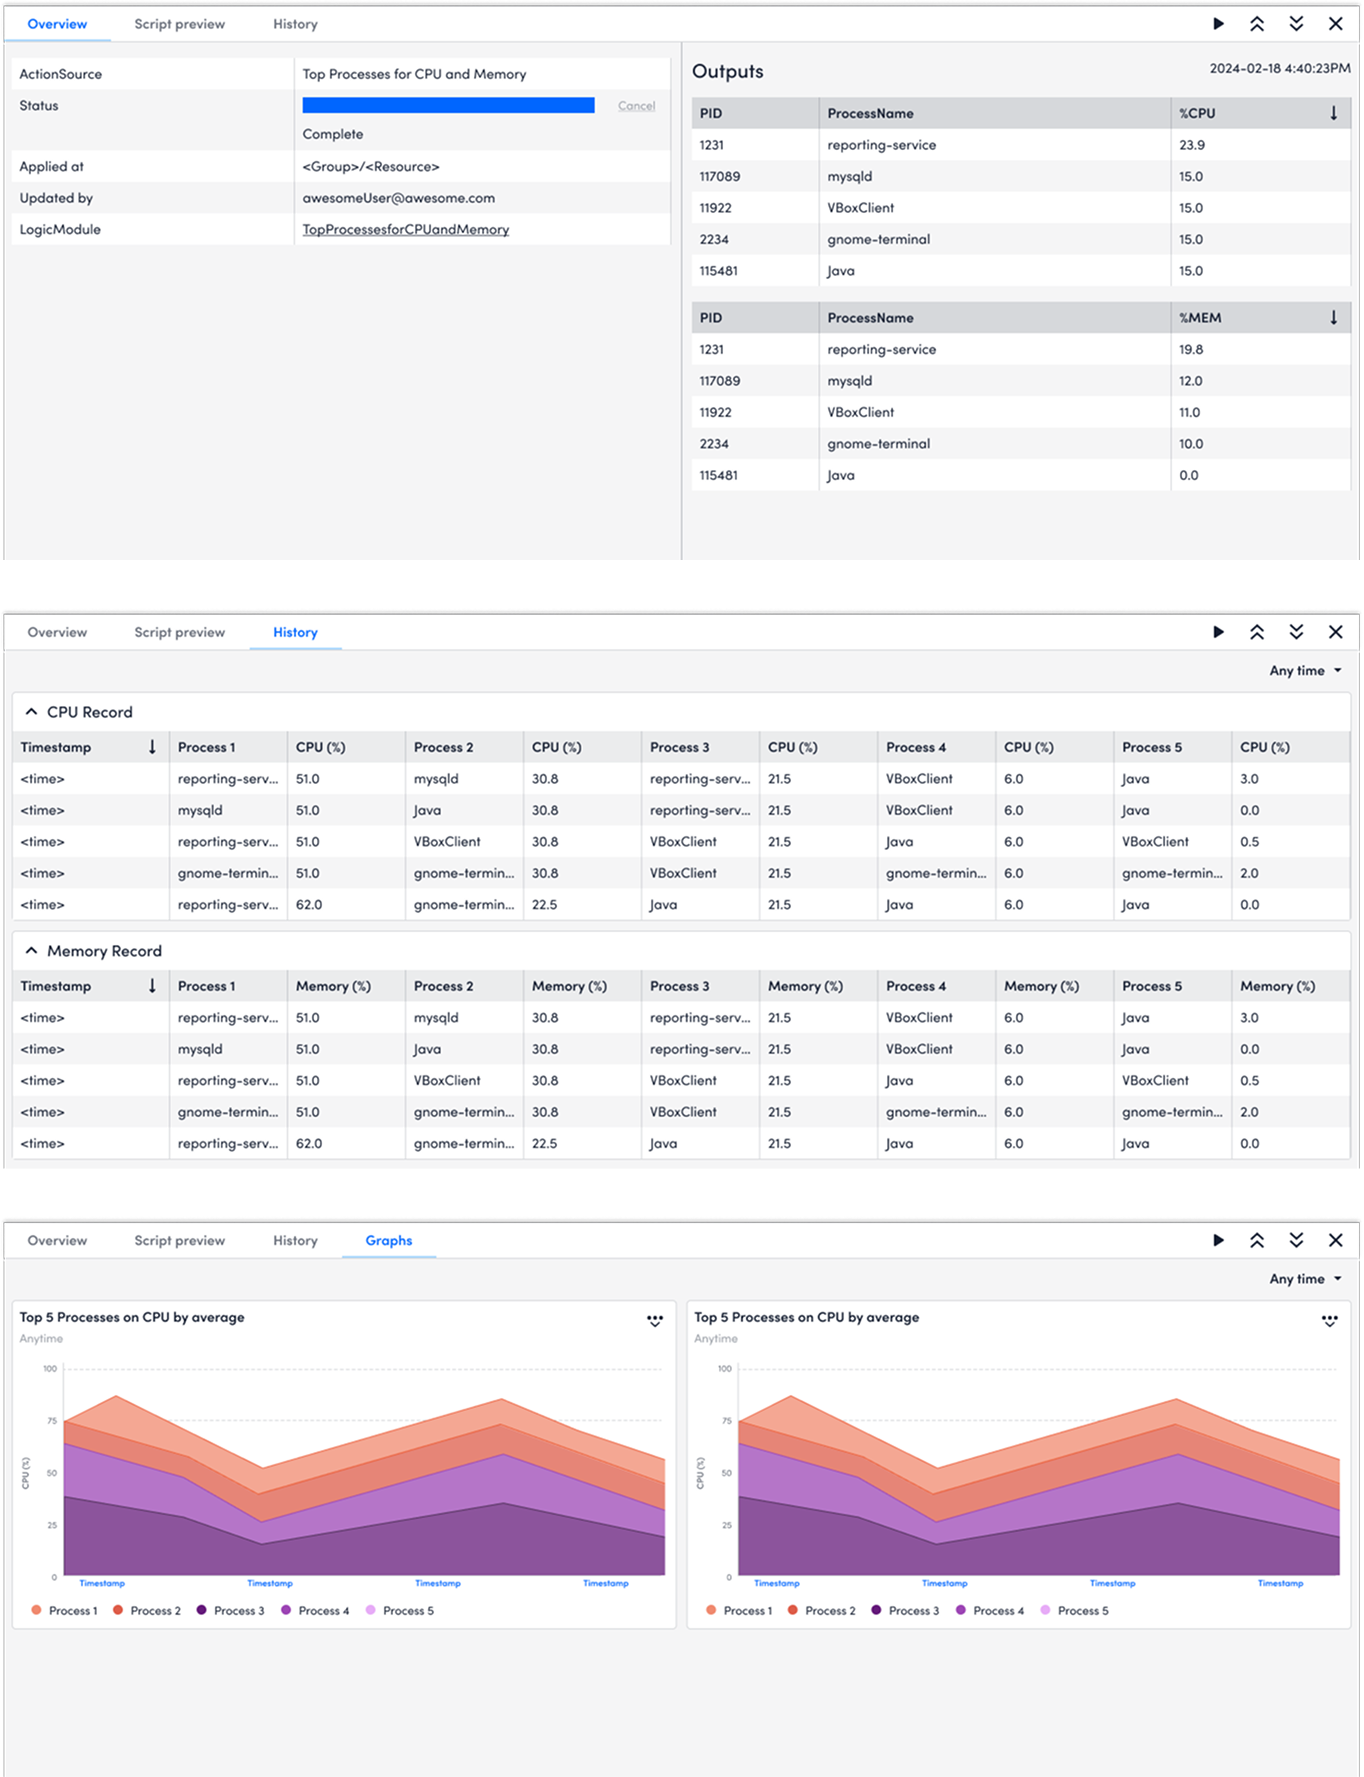
Delivery
Manually run a DiagnosticSource
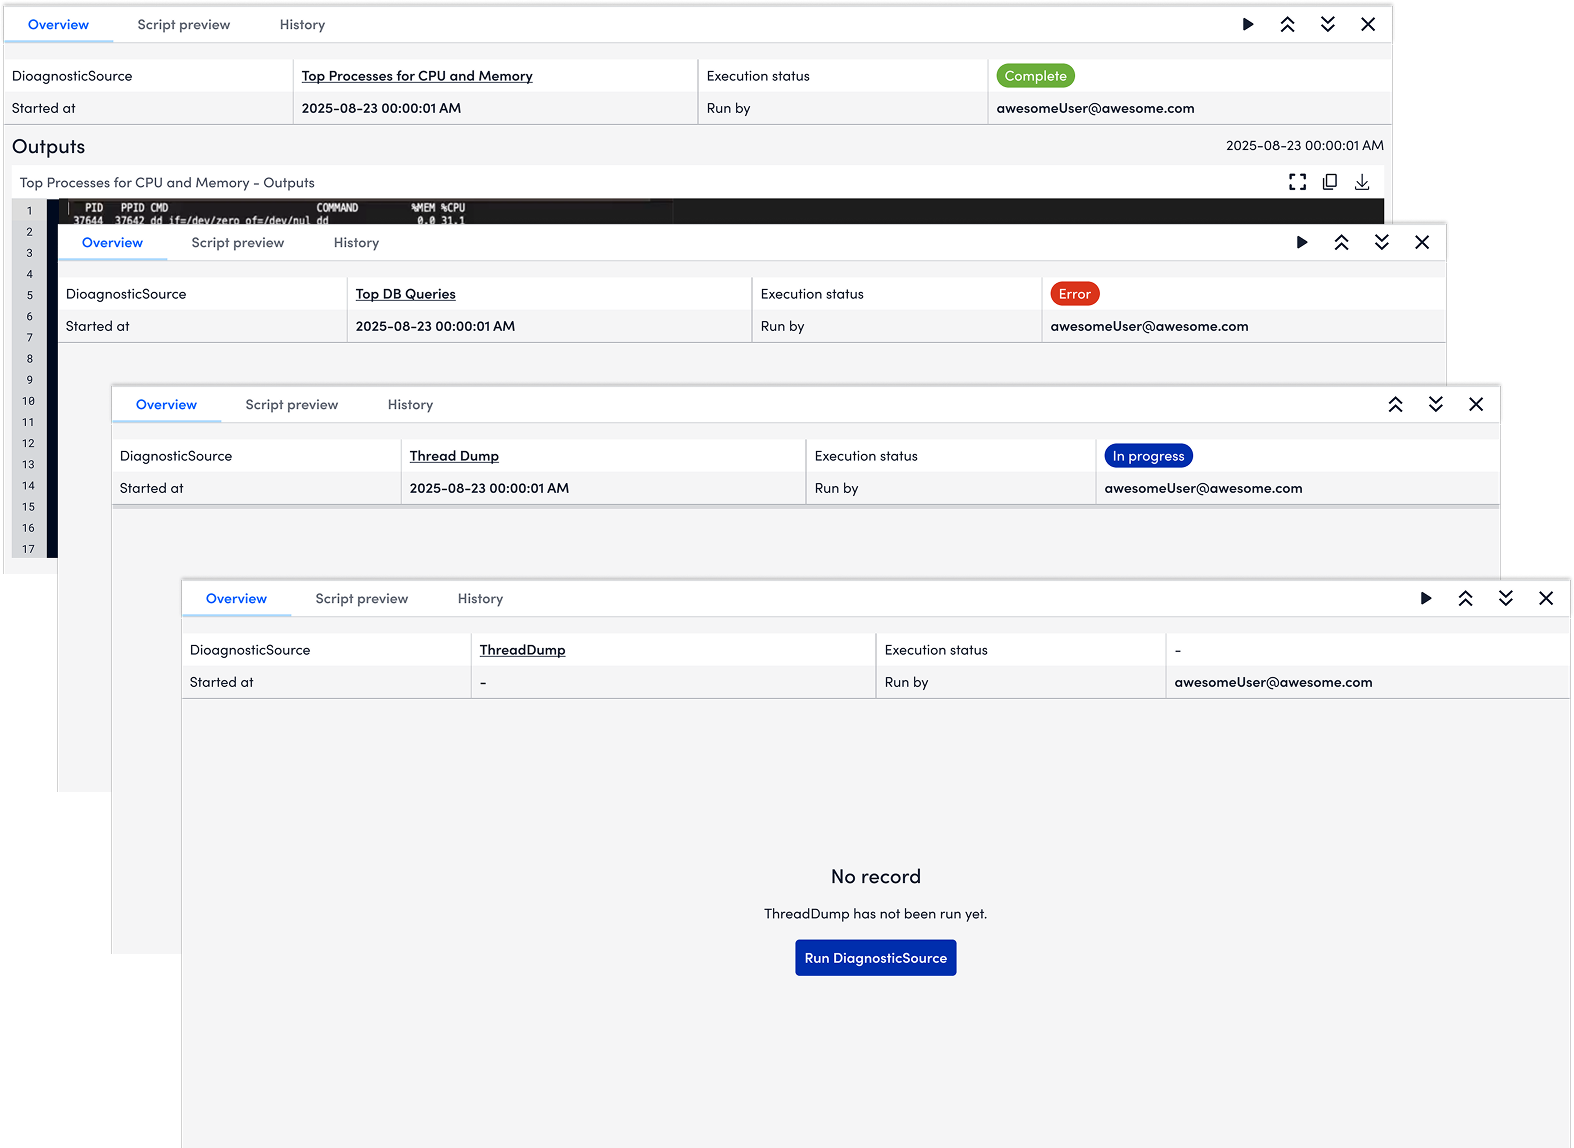
For proactive troubleshooting flow where users would routinely run diagnostics to do health check, users will run diagnostics at the device level on Resources. As what matters most to users is the diagnostics outputs, I used the major viewport to show the diagnostic outputs. In addition, users could check the script by clicking Script preview before running the diagnostics.
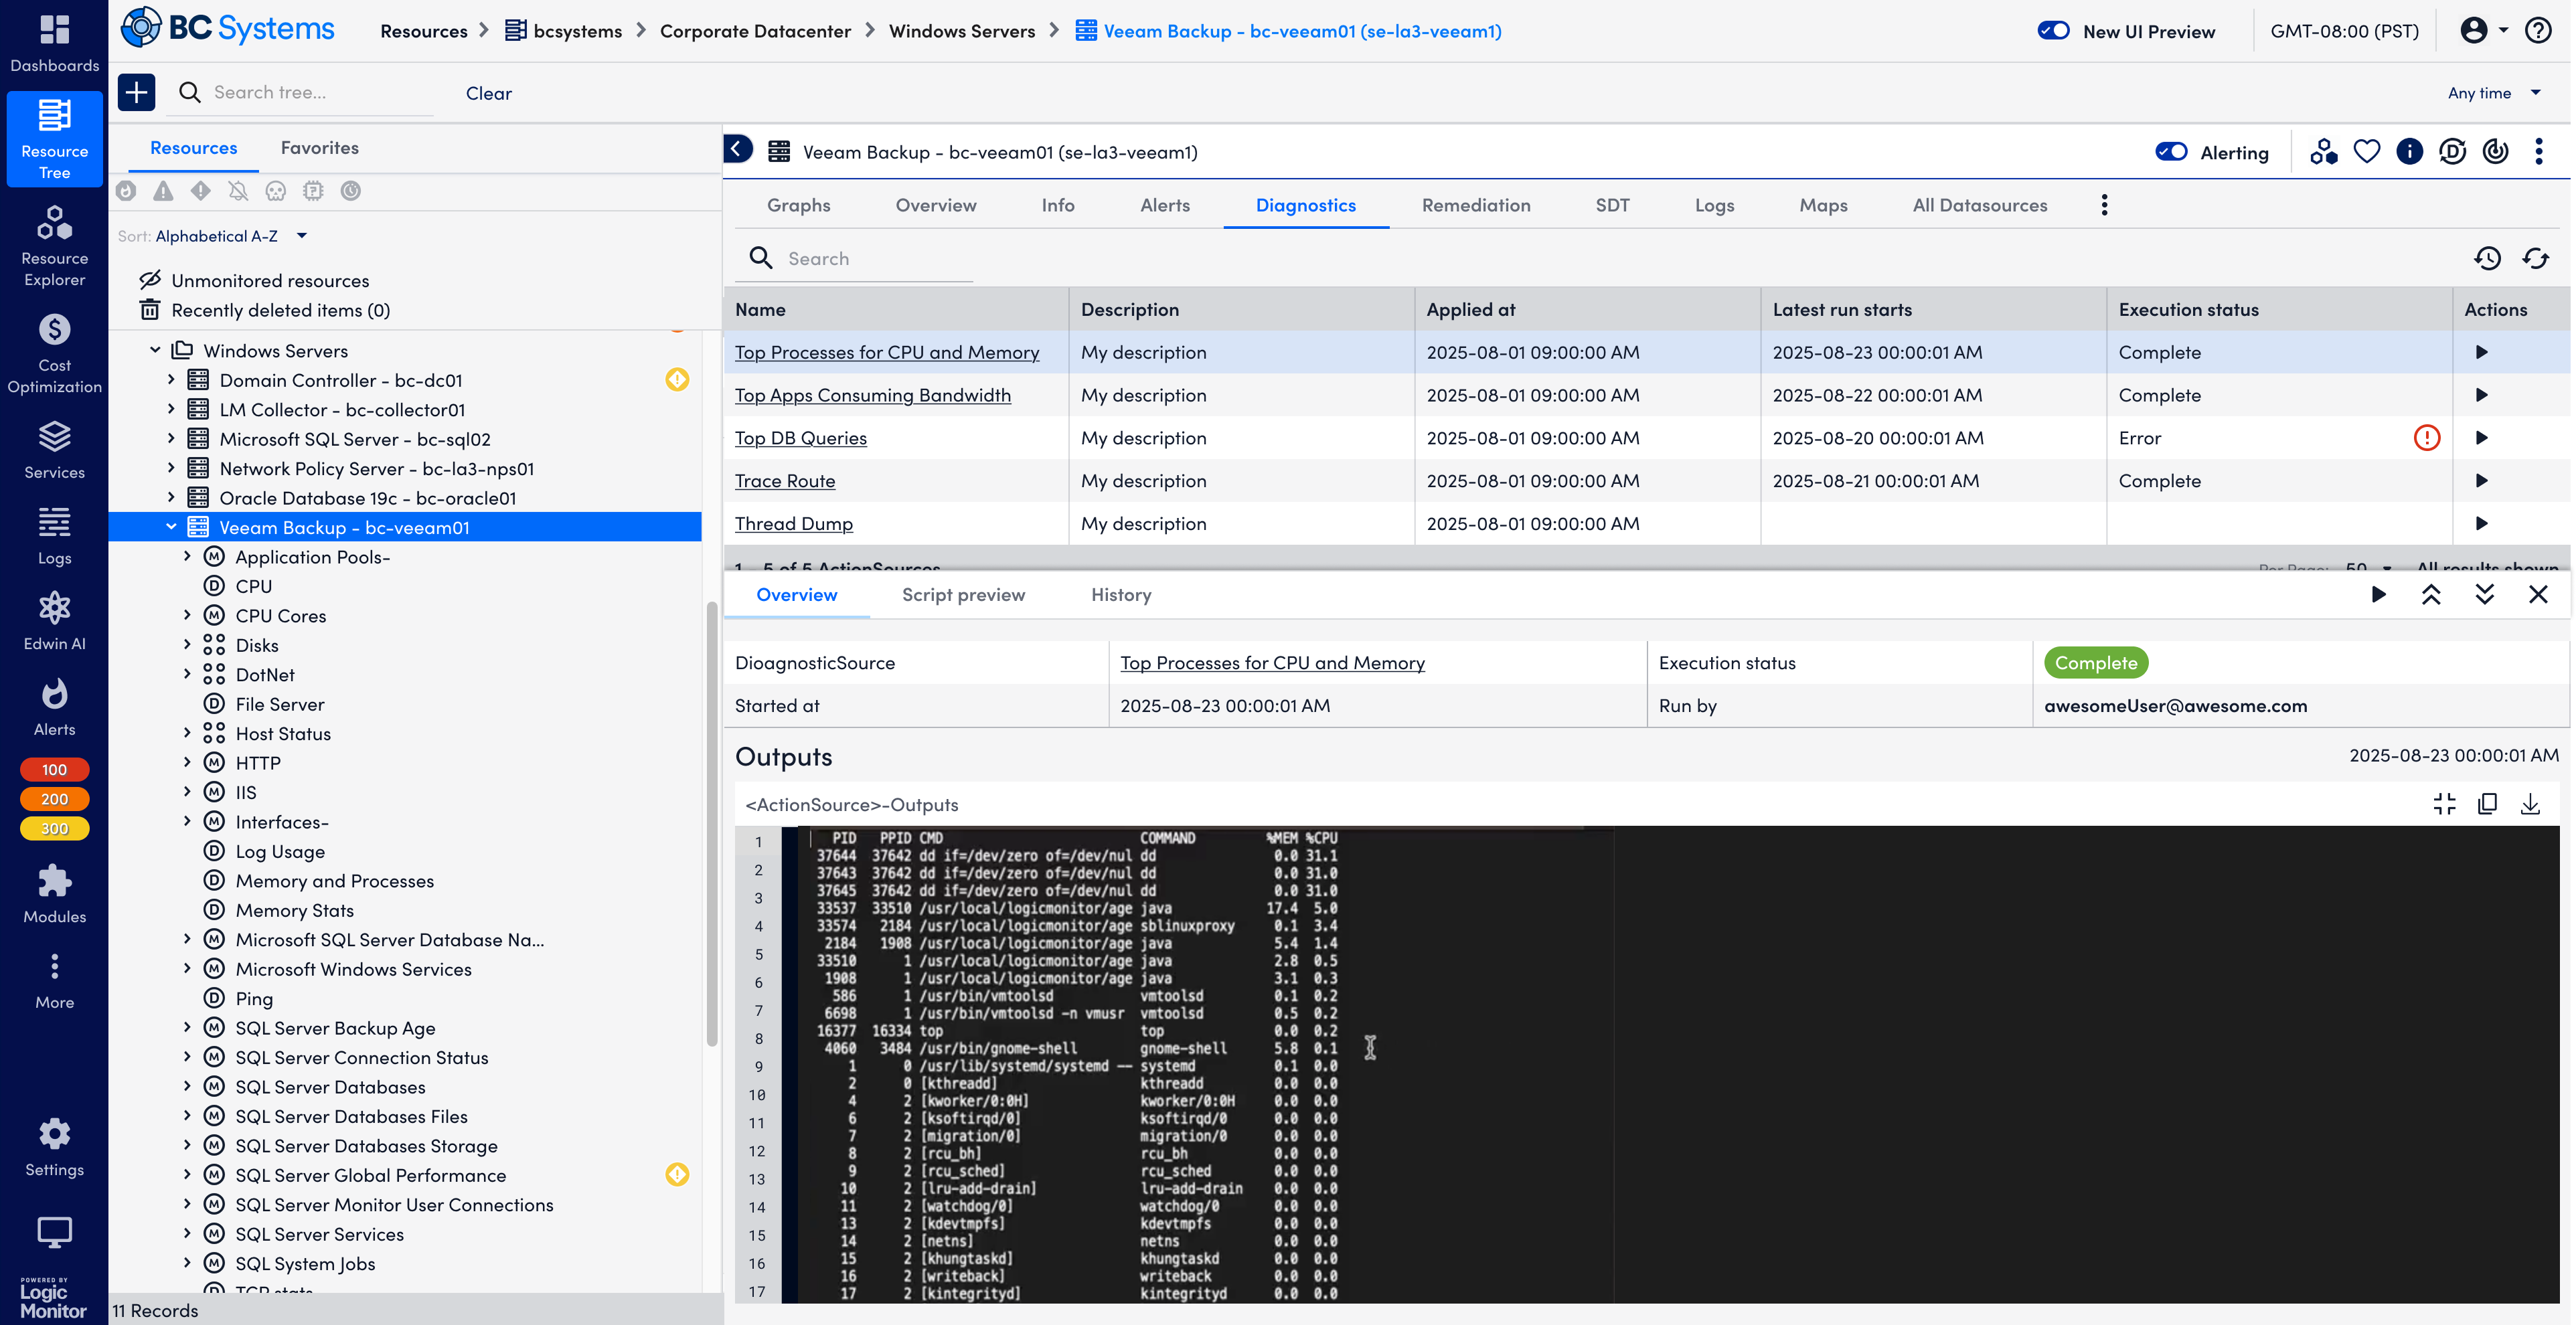
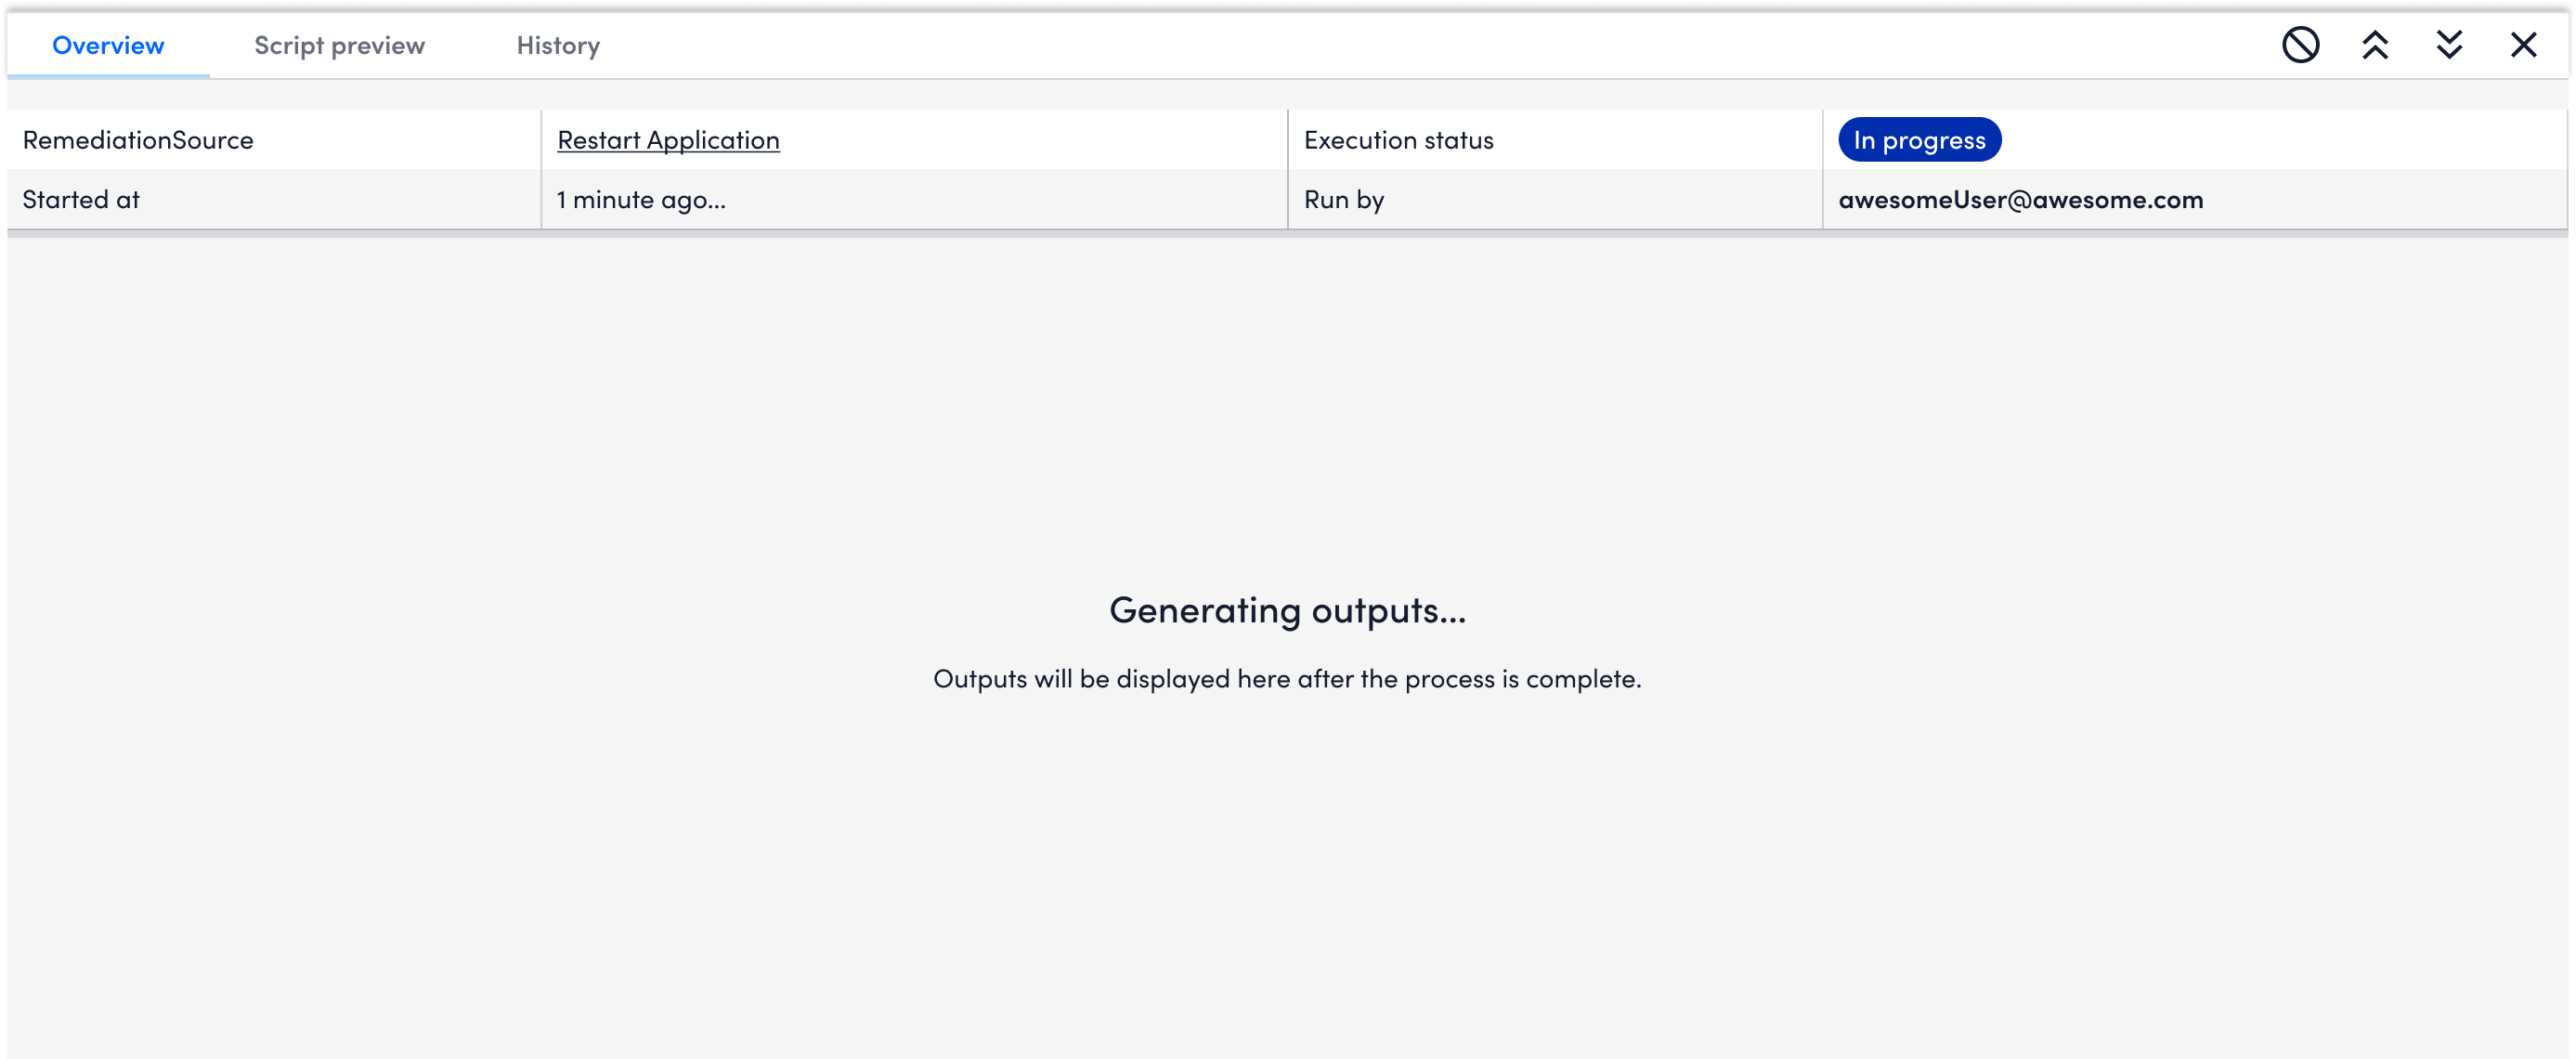
The design files also include the different status - error, success, in progress, and empty.
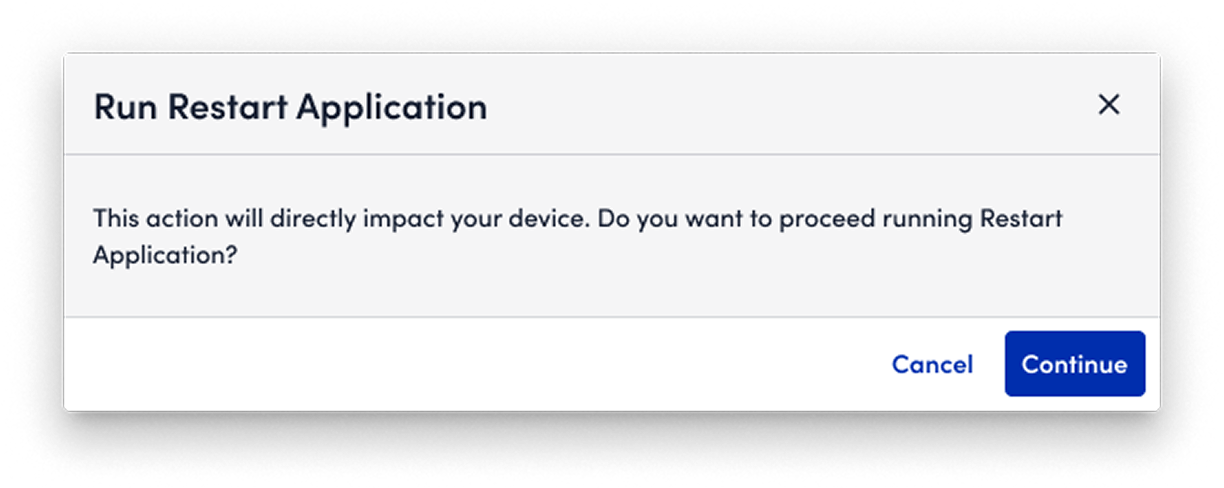
❌ I tried to include a "brake" function in the design. But after aligning with engineers, it might not work to stop the execution.
✅ As an alternative, I add "friction" to users' action. After they click running, a pop-up window will appear to ask users to confirm their action.
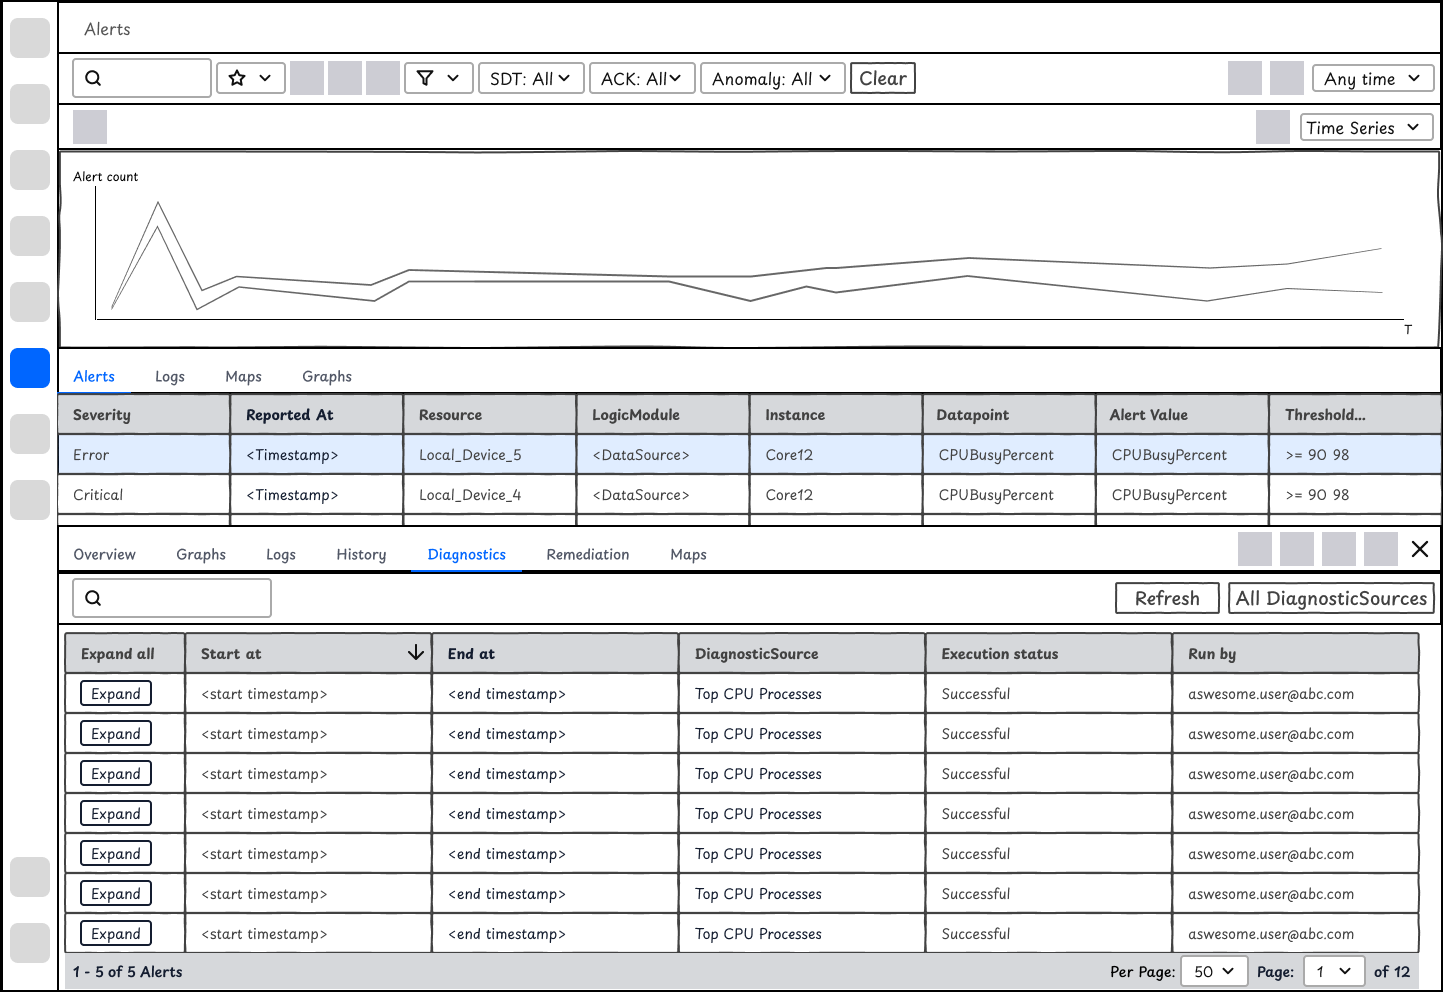
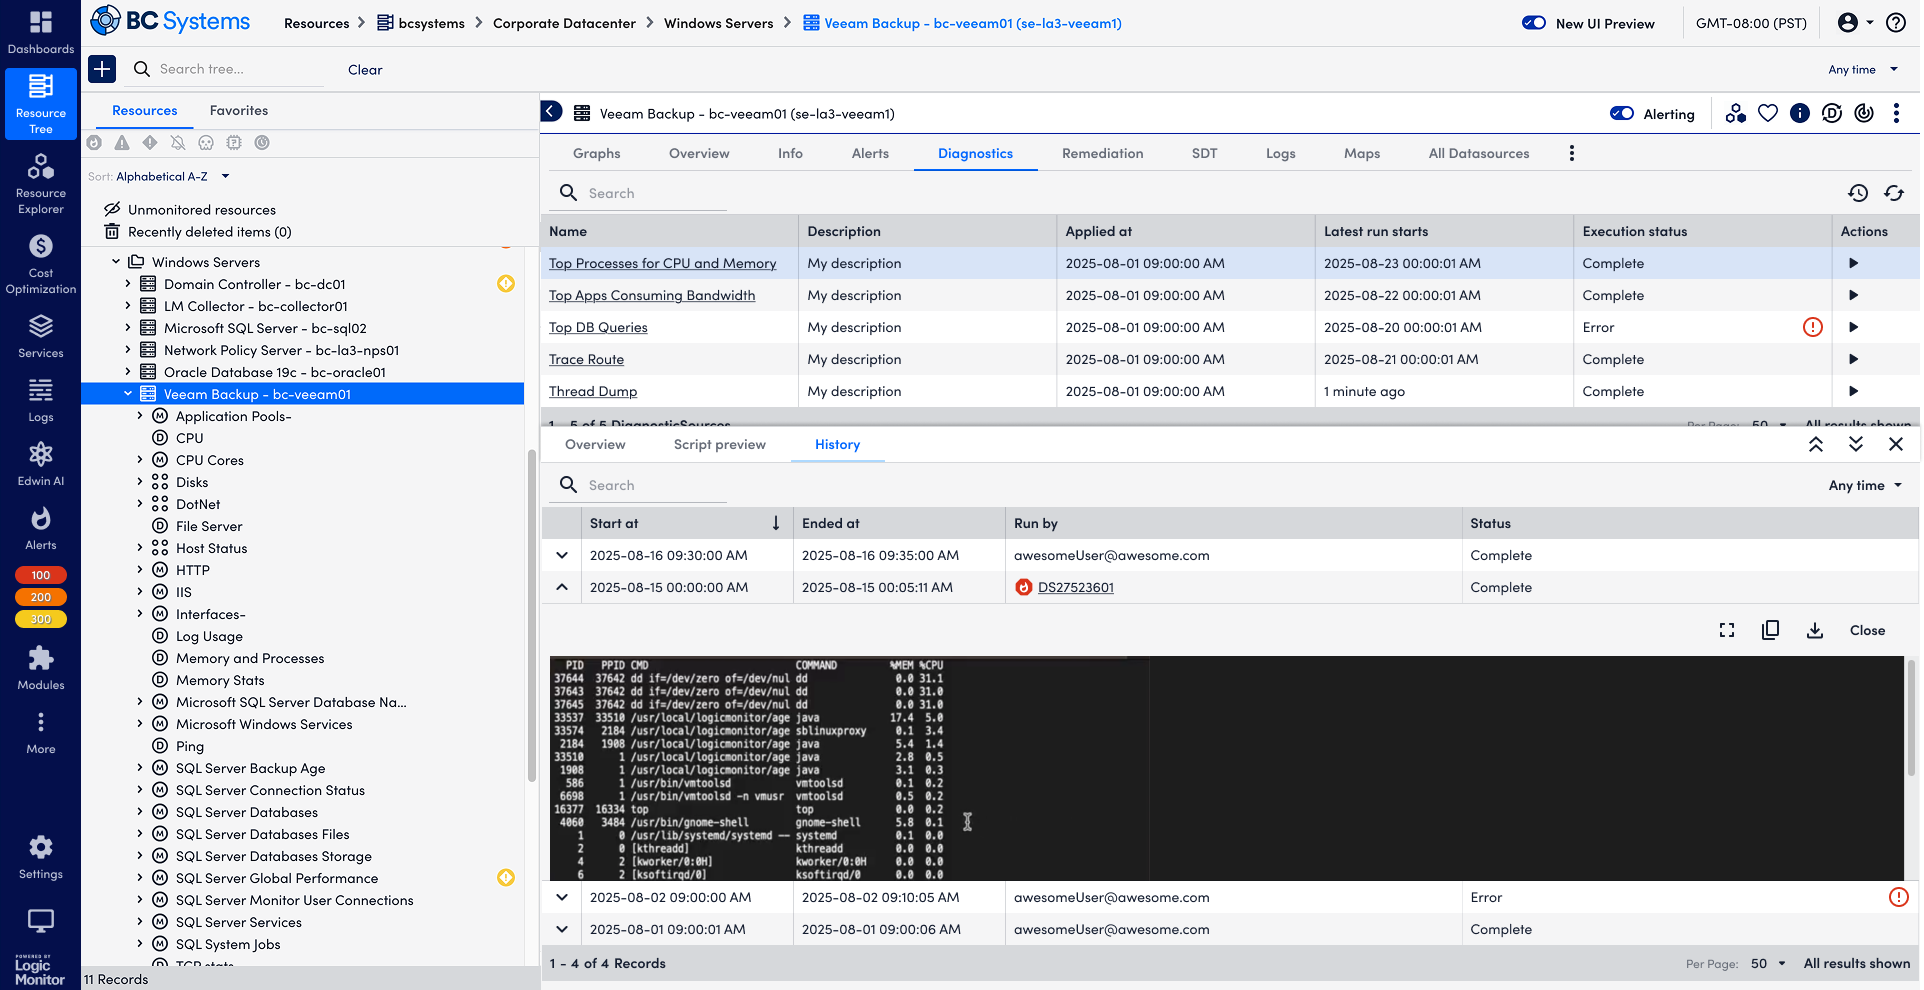
View previous diagnostics outputs
Users are able to view the history of a single DiagnosticSource. History is helpful for users to understand the baseline and any anomaly. Given it's placed in a complex product structure, I used collapsed rows to help users navigate the record while also enable users to view the outputs. Meanwhile, after users locate the record that they are interested in, they could use Fullscreen to view the output in details.
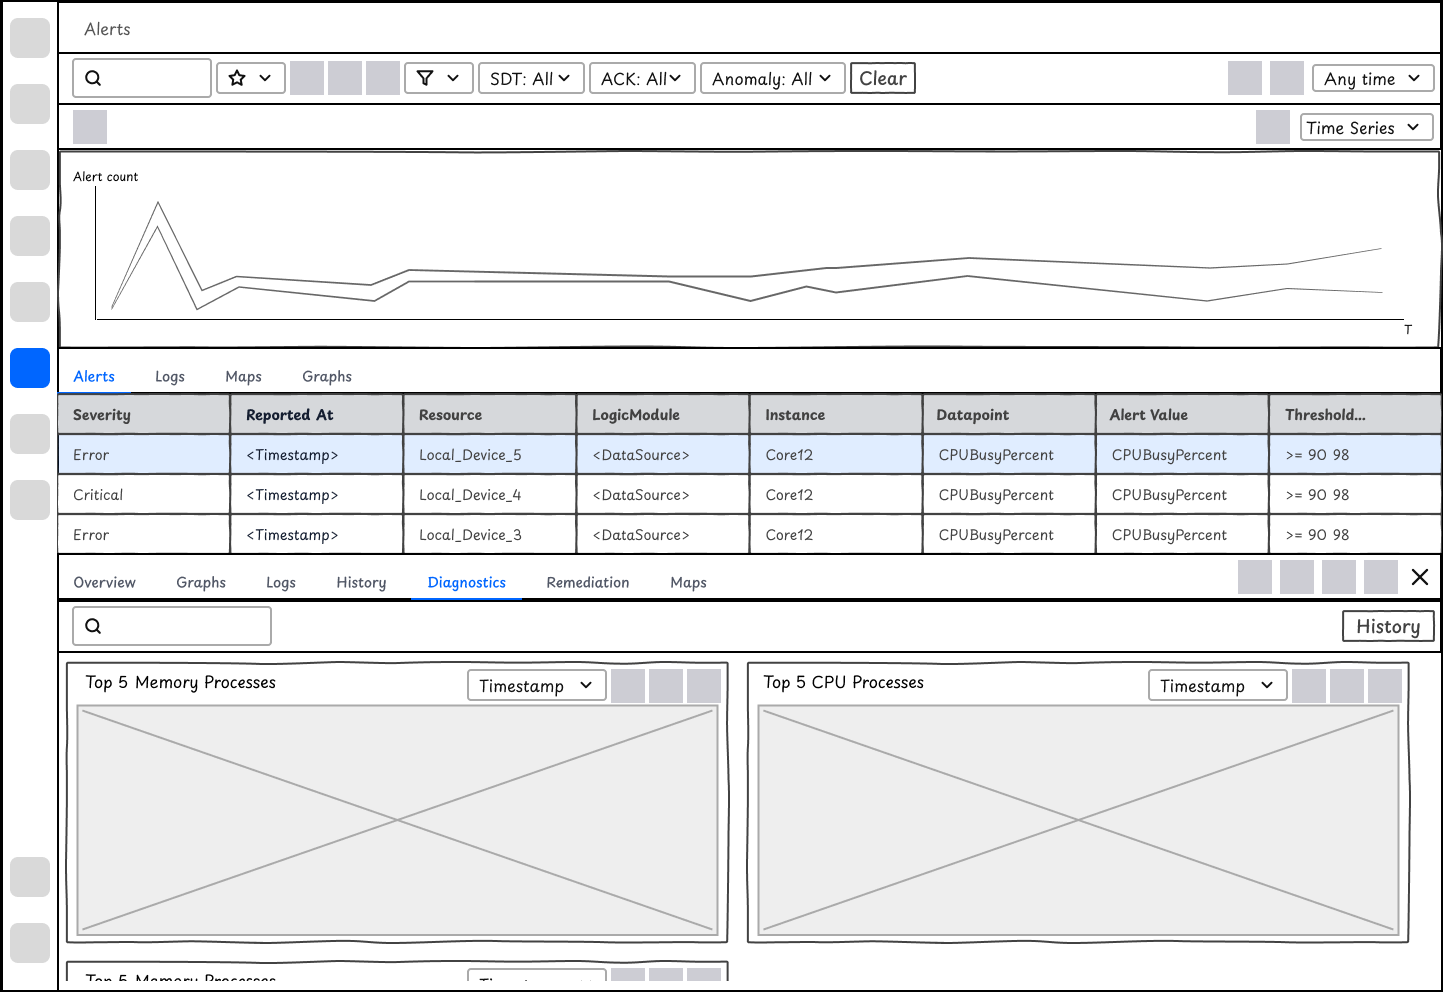
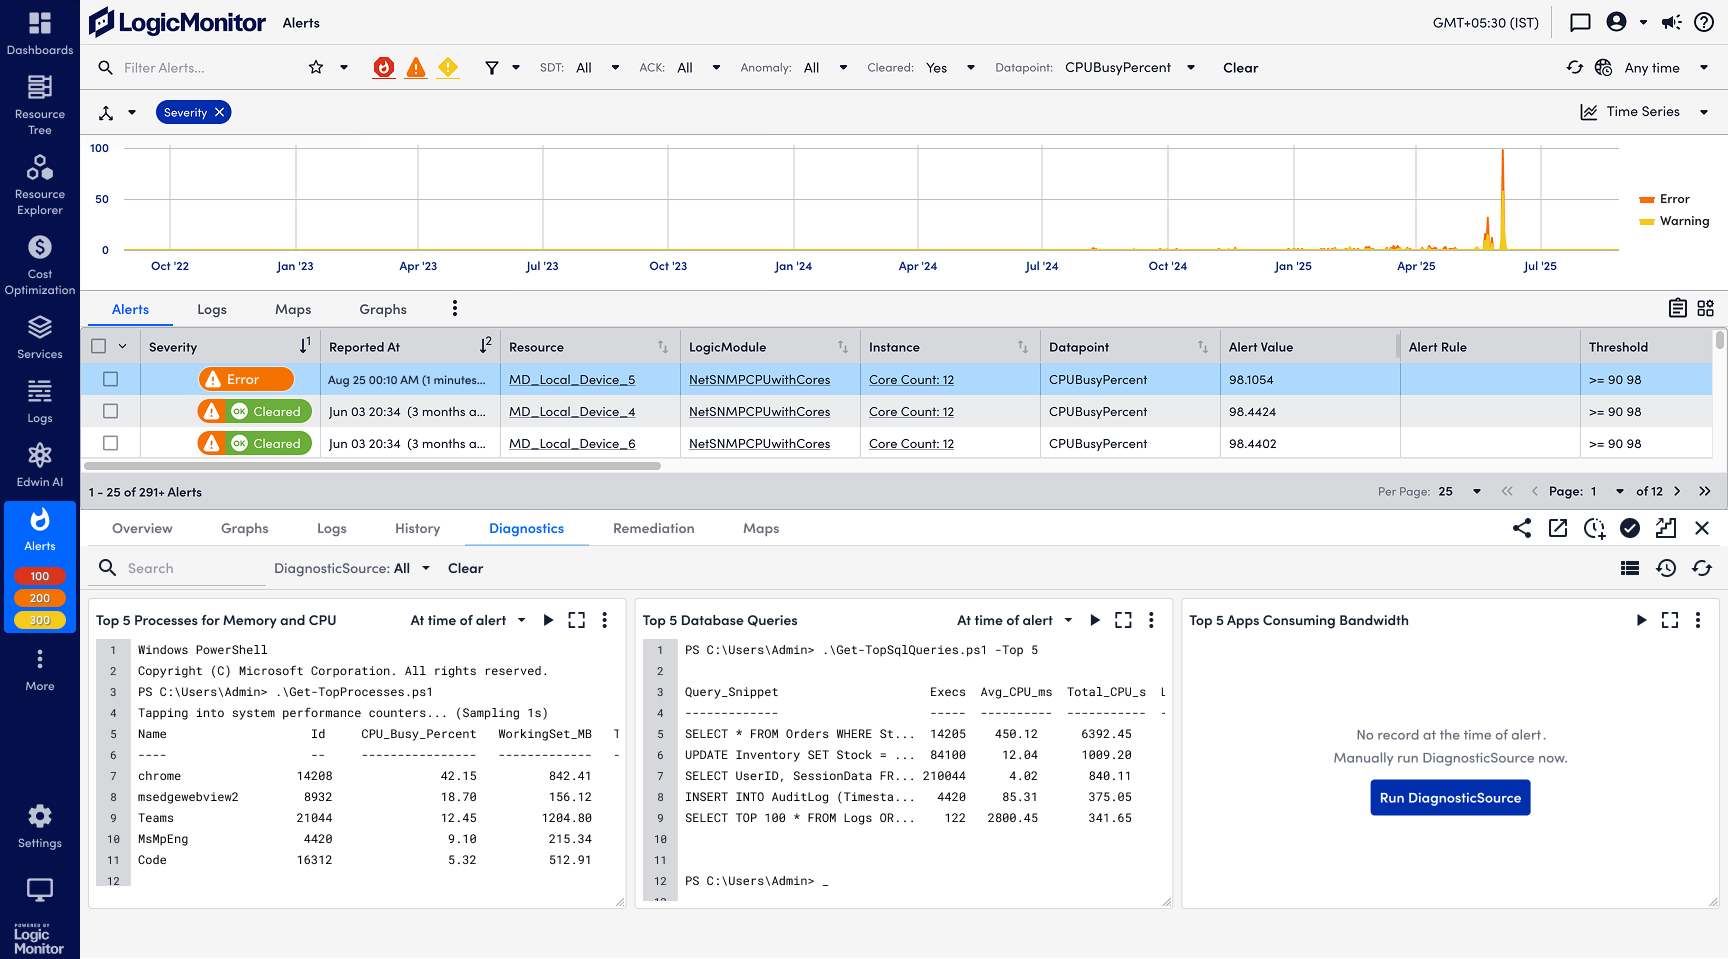
Automated Diagnostics at the time of alerts
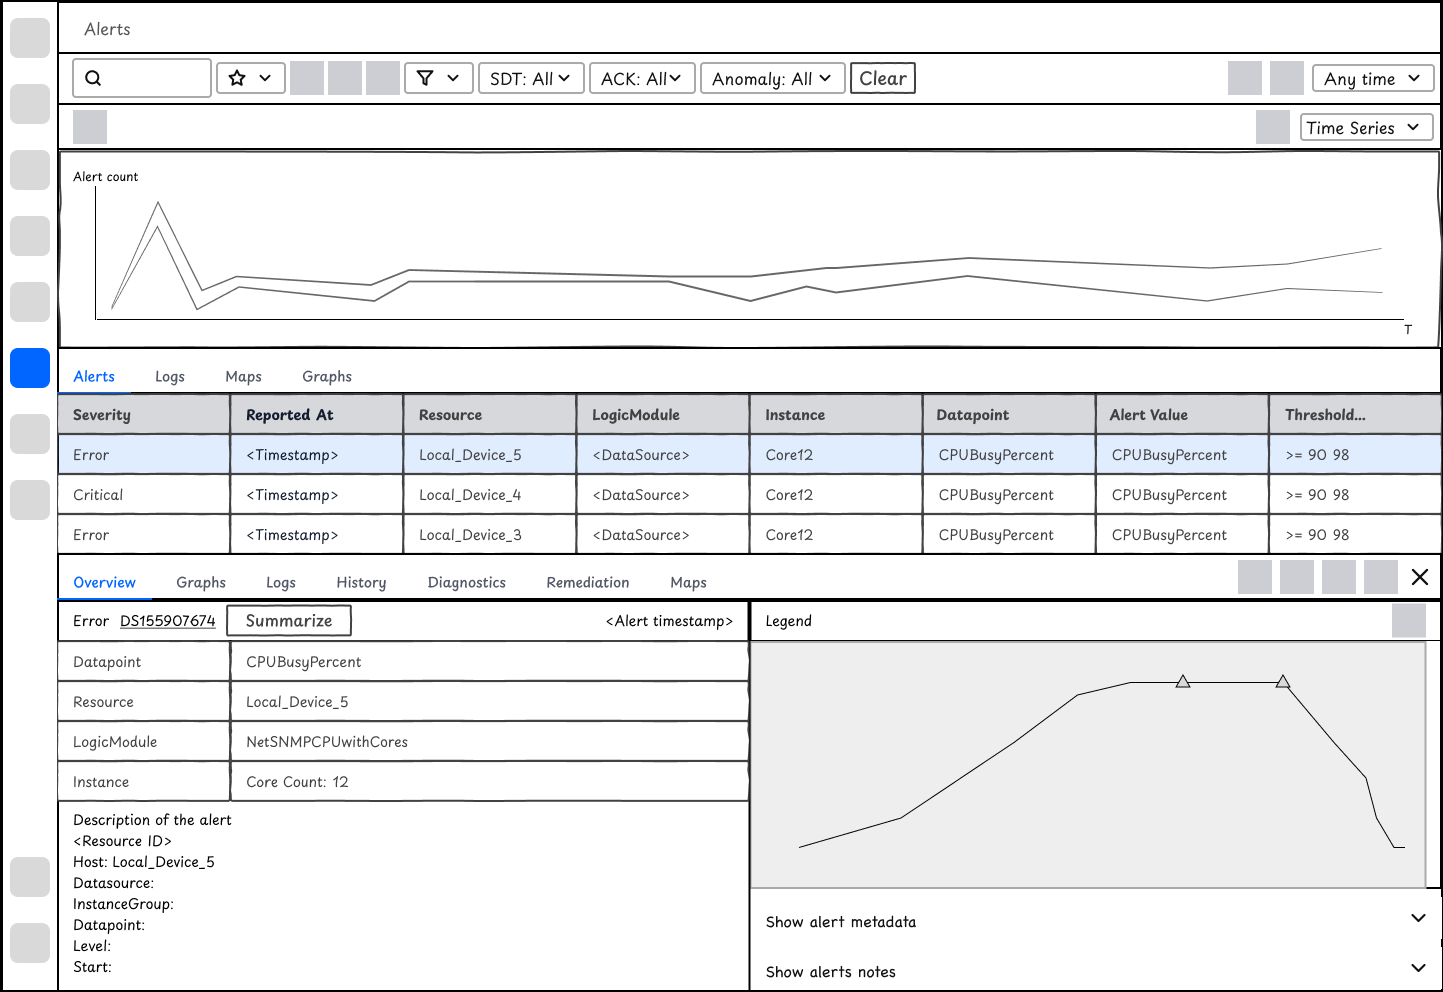
Users could view automated diagnostic outputs after they configured their Diagnostic and Remediation rules. Similar to Resources, Alerts has a complex information architecture. To give users what they want to see immediately, i.e. the diagnostic outputs at the time of alerts, the design is changed to tiles of widgets displaying the information that matters most to users, instead of a list of DiagnosticSources that require select, history, and view outputs among other steps for users to find the data.
Validate the effects of Remediation
While the outputs of diagnostics matter most to users, the use case for remediation is different - what users care most is whether the remediation actions are effective on their alerts. To visualize the effects of Remediation, I added Remediation timestamps on Alert charts.