C-PAC Platform

CPAC is an open-source software pipeline for automated preprocessing and analysis of resting-state brain activity image (fMRI) data. CPAC aims to make it easy for both novice users and experts to explore brain imaging data by quickly configuring data processing pipelines. I covered end-to-end process for this project and deliver UI to devs for development.

Role

UX Designer, Researcher

Co-design

Ann Tsai
Eric Nordquist

Heading

Lead Product Designer

Duration

Apr - Aug 2021

My Role
Junior designer, Researcher
Timeline
Mar 2021 - Aug 2022
Shipped
Teammates
Collaborate with Chieh-Ann Tsai,
guided by Eric Nordquist
Tools
Figma, Figjam

Context

CPAC is short for Configurable Pipeline for the Analysis of Connectomes (C-PAC), an open-source software pipeline for automated preprocessing and analysis of resting-state brain activity image data (fMRI). Dell Medical School of UT Austin and Child Mind Institute aim to build C-PAC portal for scientists to process brain activity images and prep for algorithm training. Ann and I completed designing C-PAC portal, starting from research, ideation to high-fidelity UI delivery under the supervision of Eric.

User Personas

After kicking off the project and discussing with stakeholders, I understood the key value propositions of C-PAC are:
- Streamline the process of data processing
- Allow users to compose the best toolkit to process their data or open datasets
- Provide an efficient way for fMRI imaging processing
- Friendly for users without a lot of computational background

There are two types of users for C-PAC:

A student reading a book
The Learner
New neuroscience students without a lot of computational background
JTBD: Get data processed quickly and without much learning burden
A mentor with rich expertise
The Expert
Experts who have been in the industry/research for several years
JTBD: Process multiple datasets with different pipelines efficiently
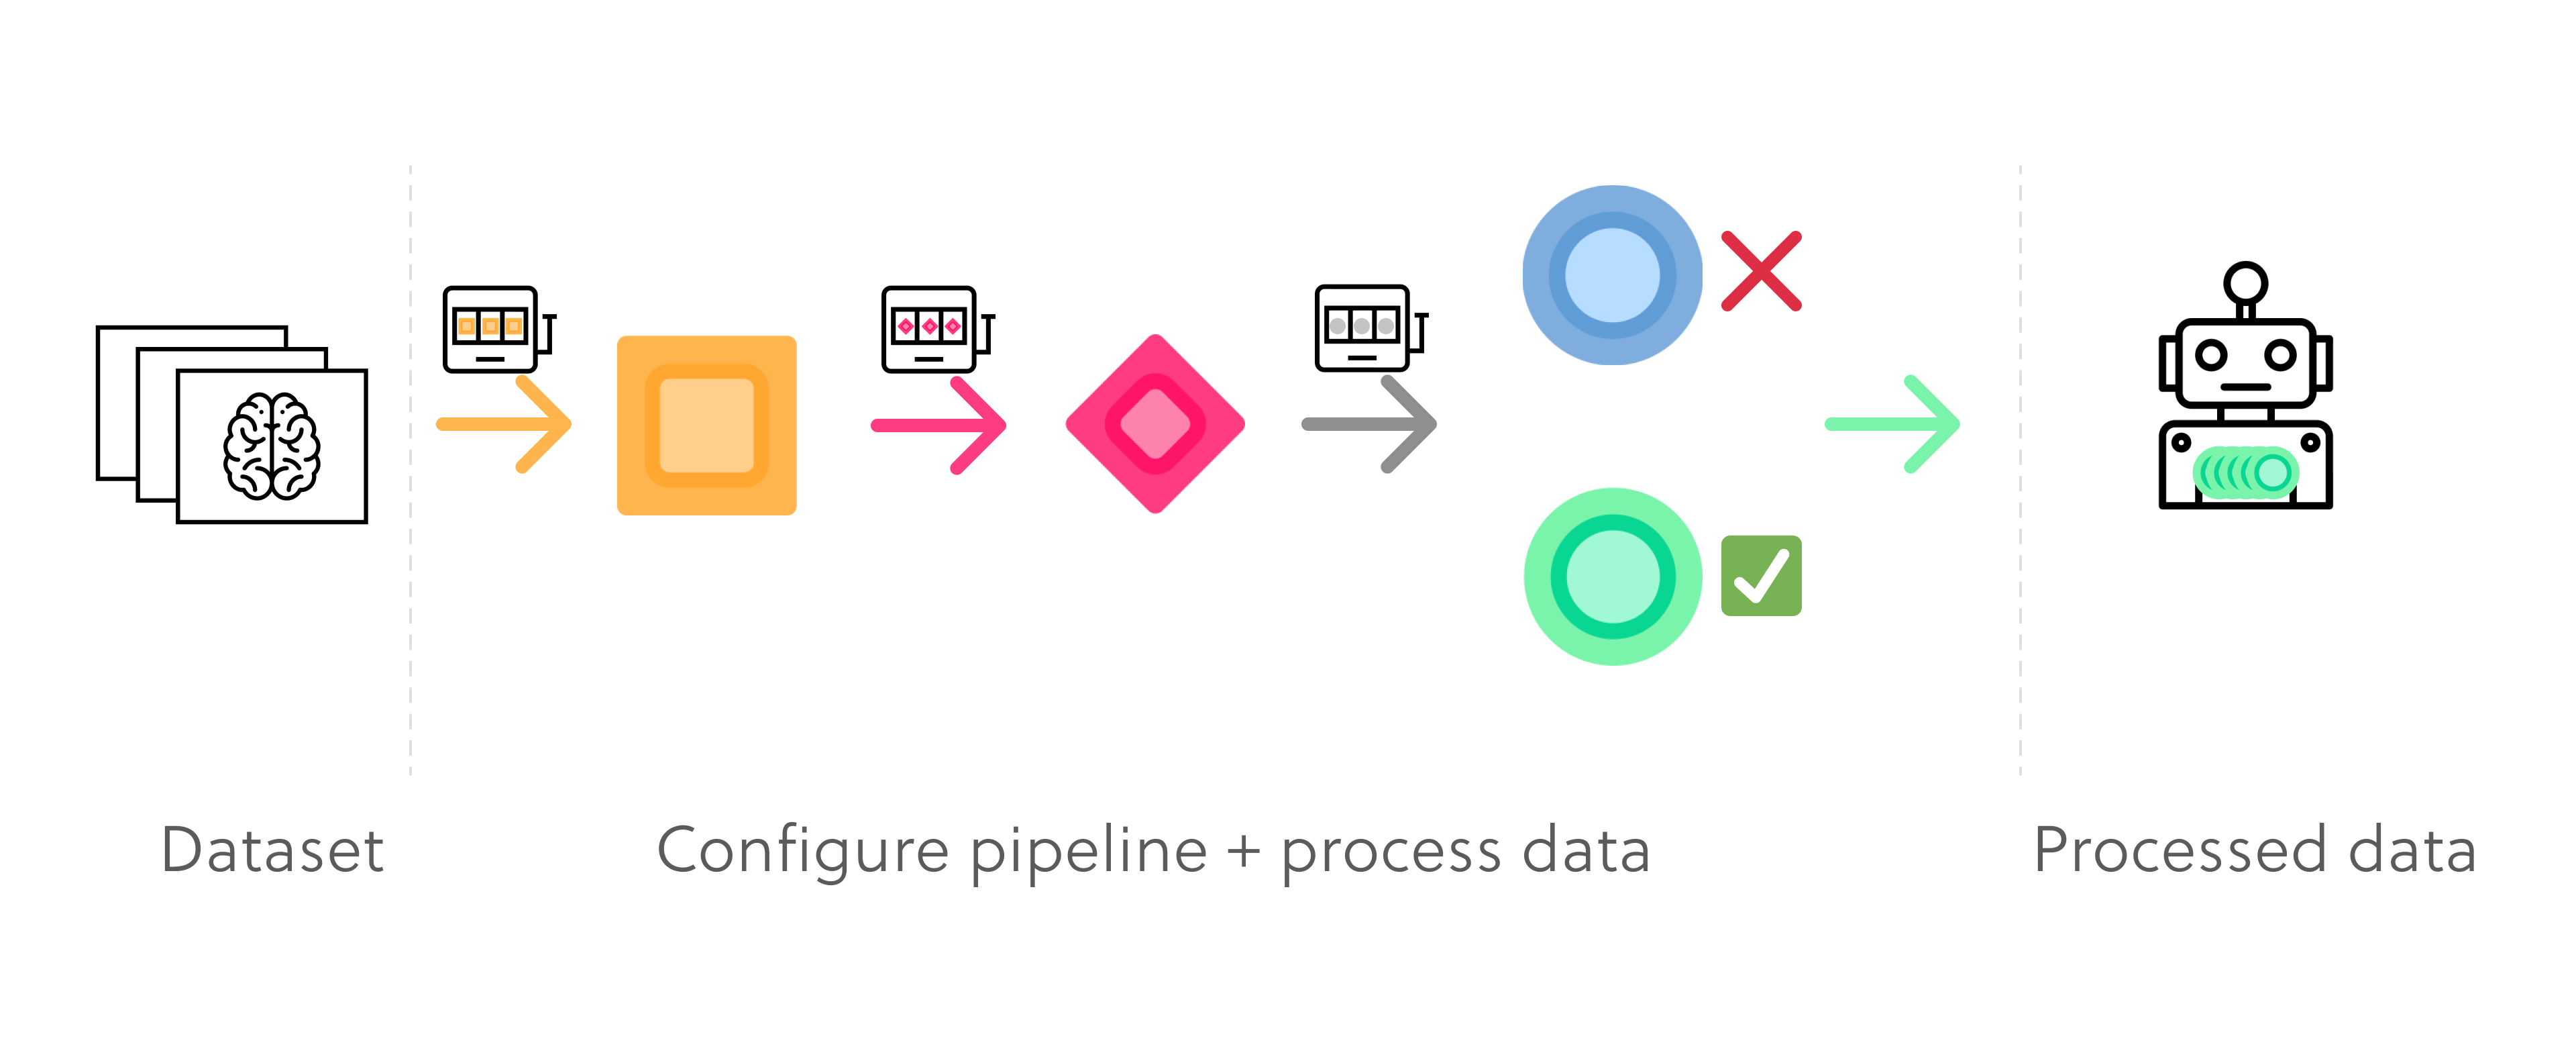
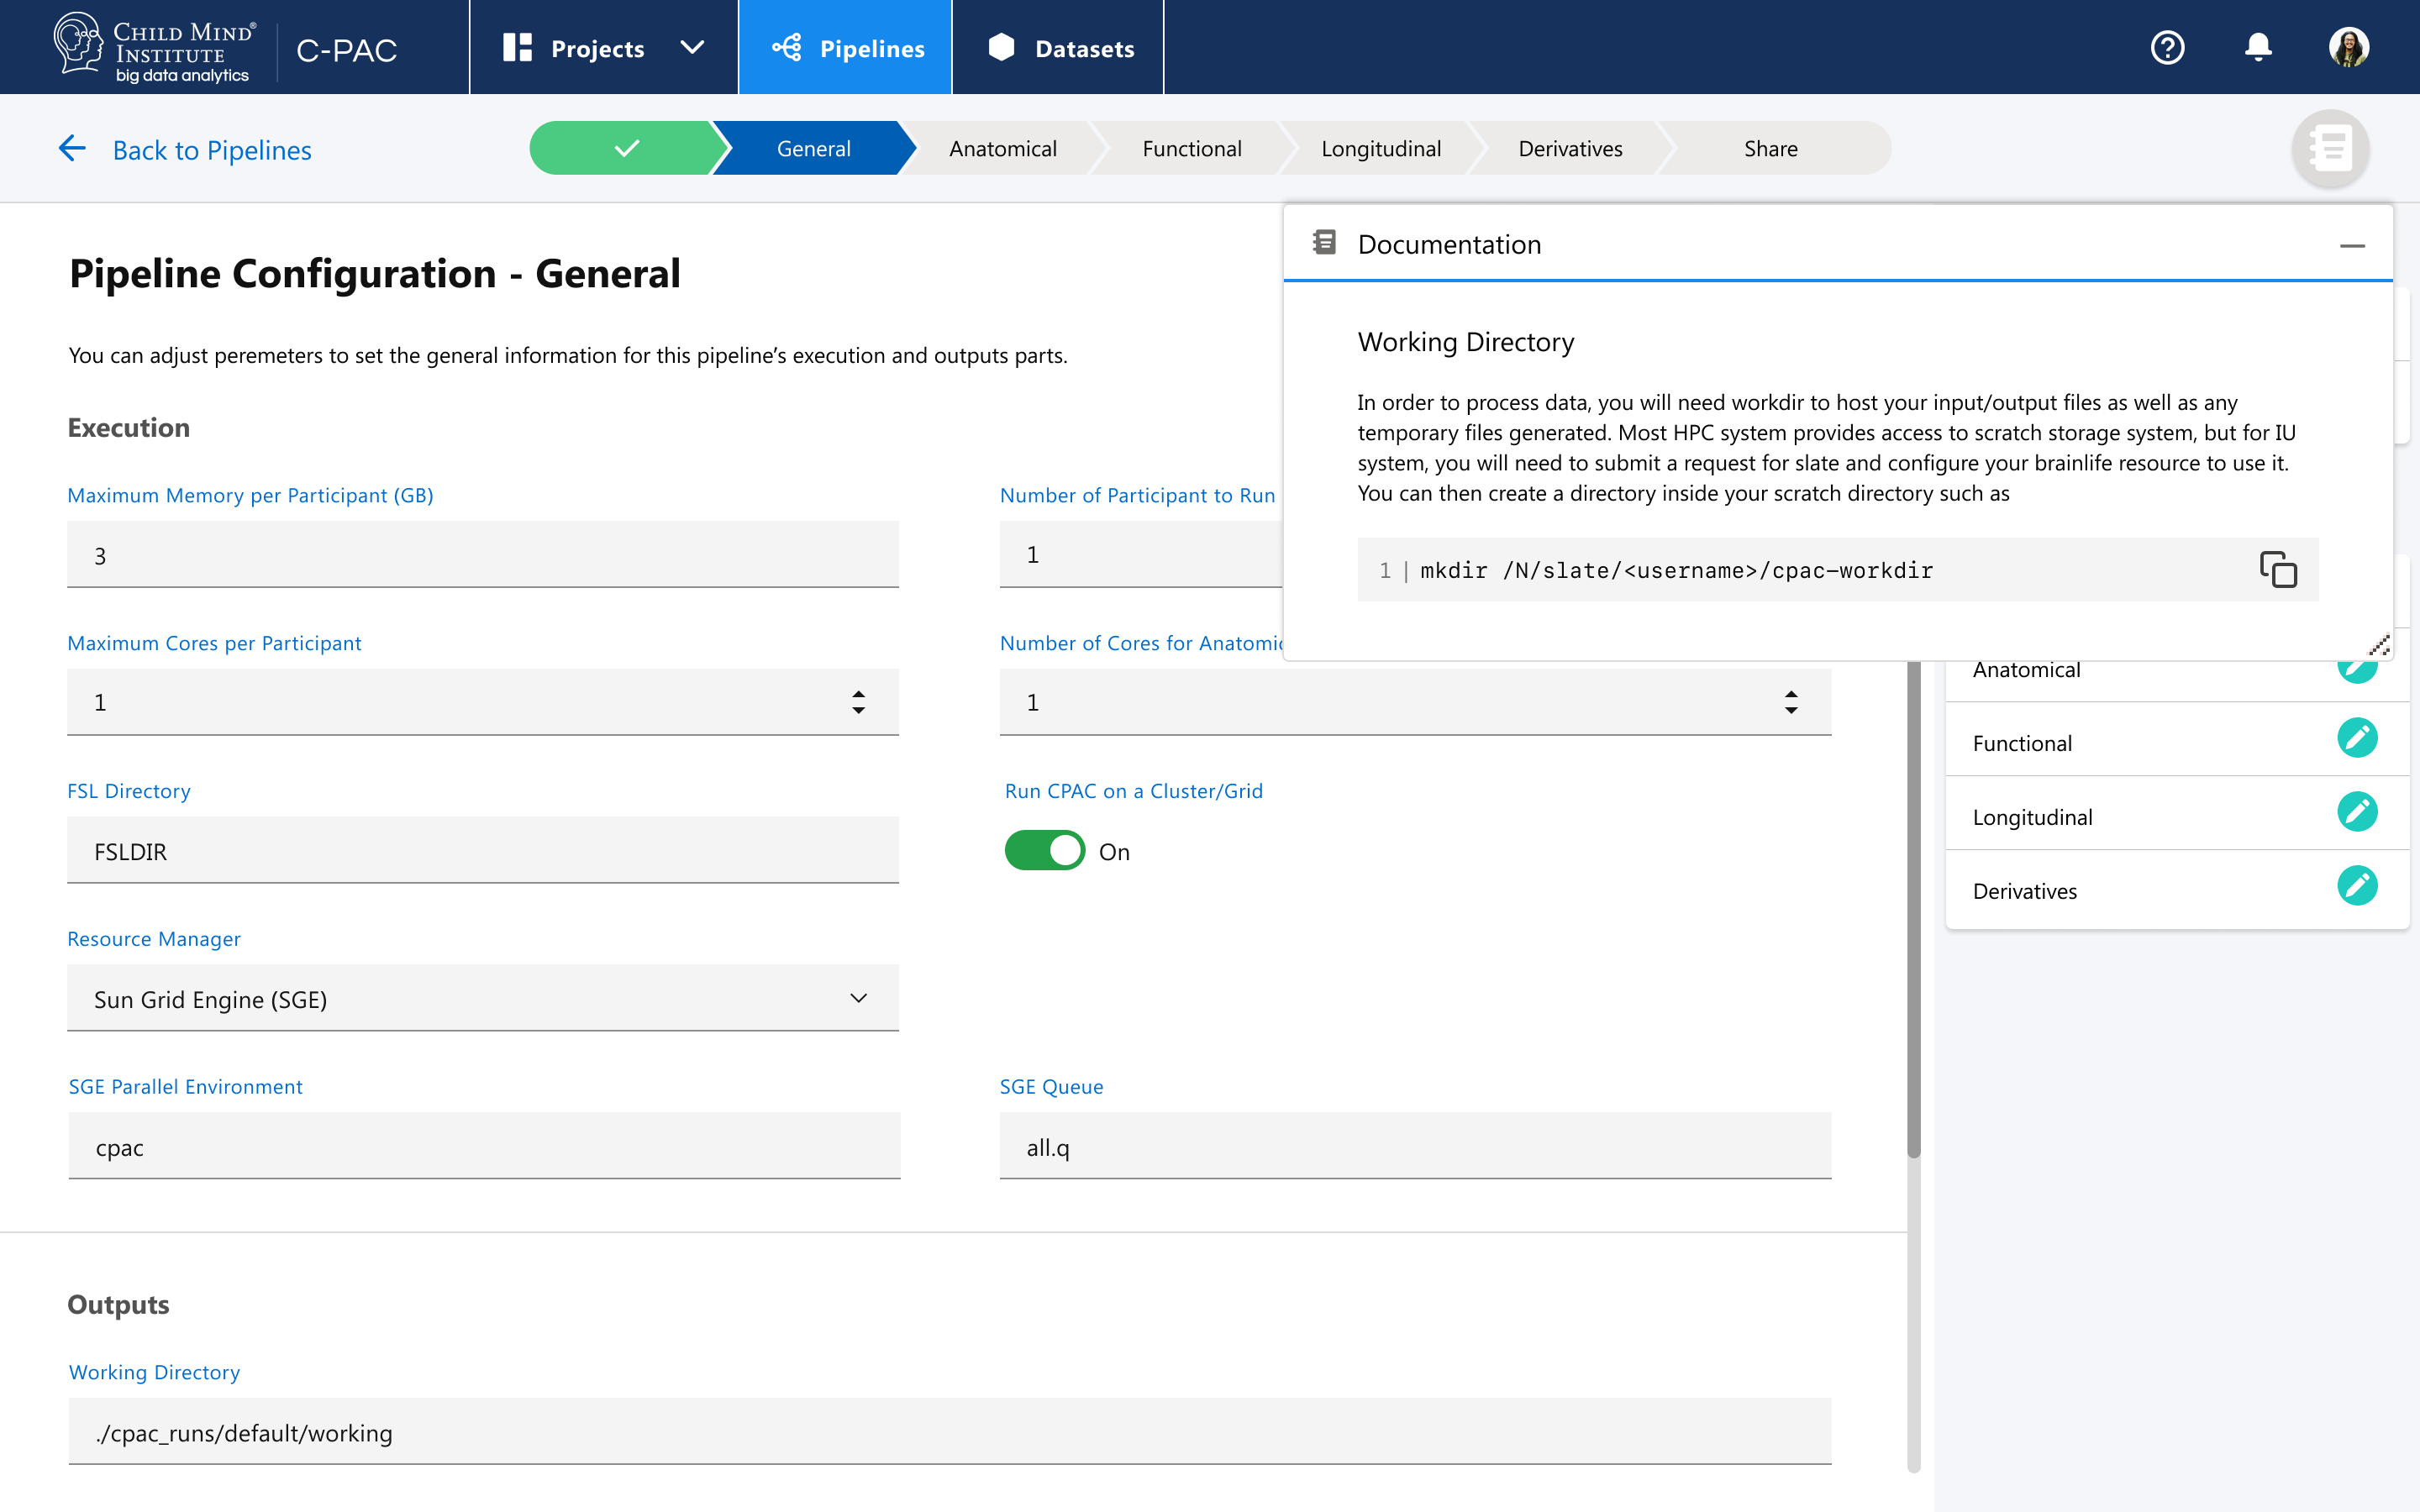
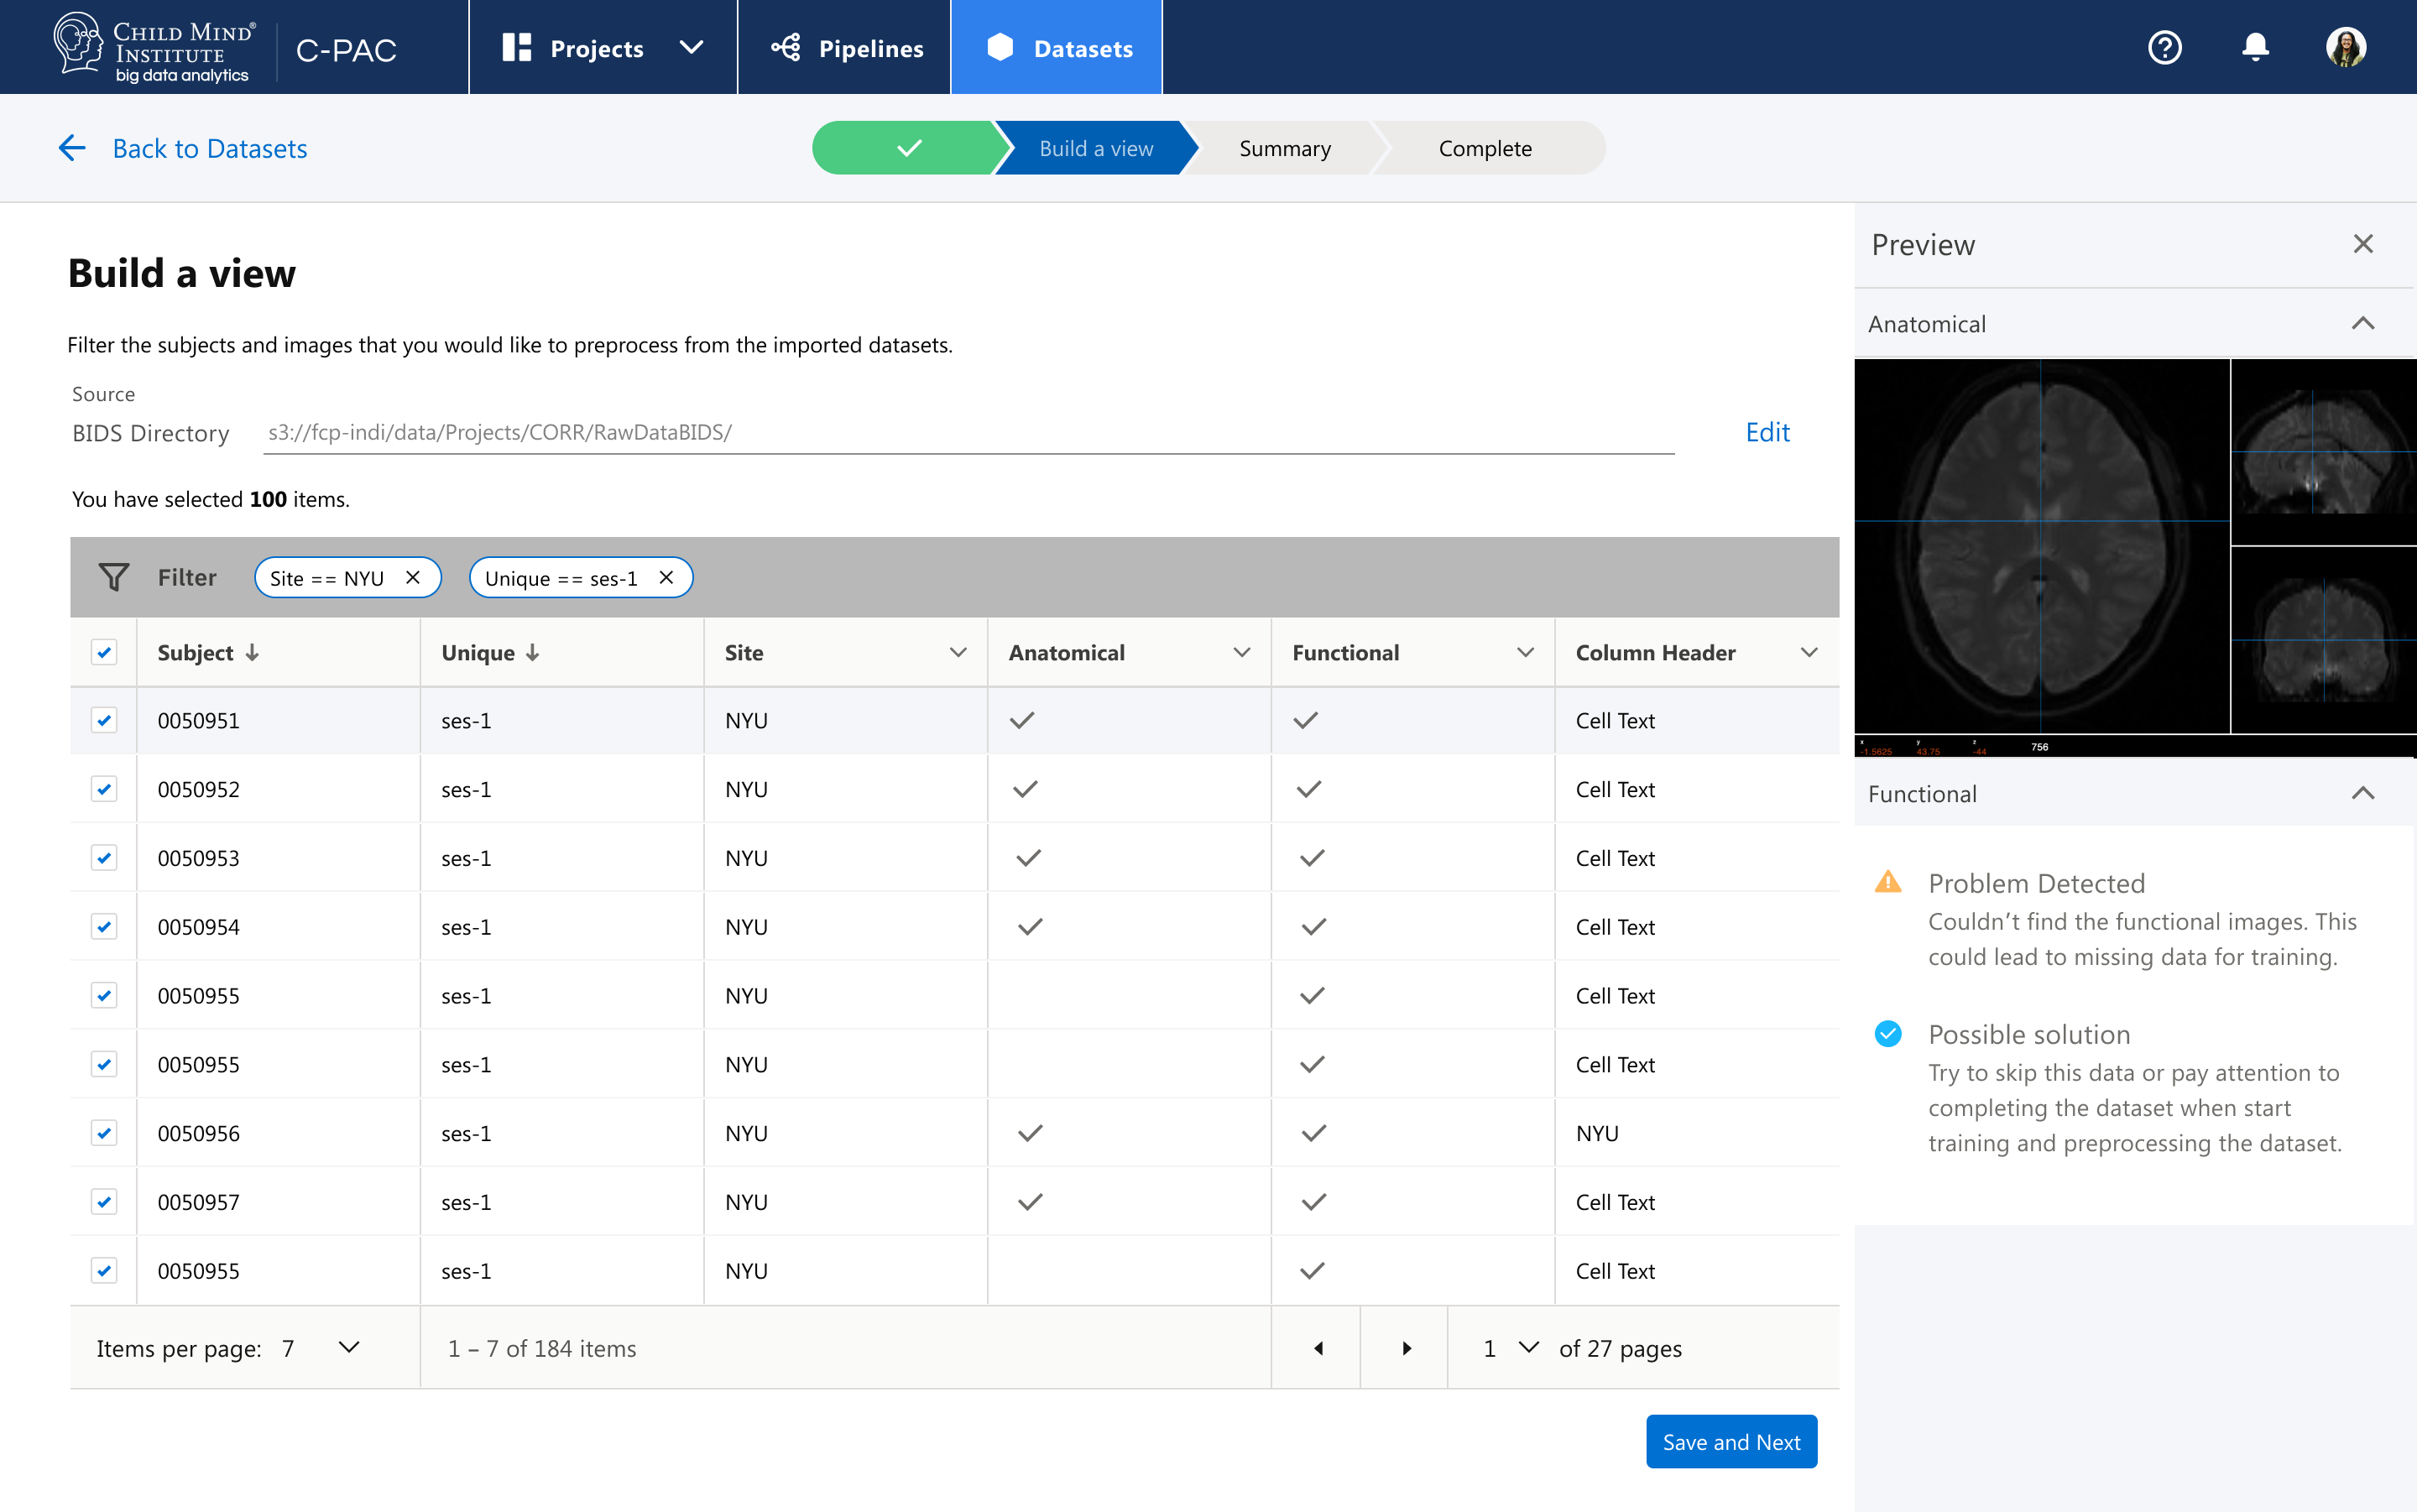
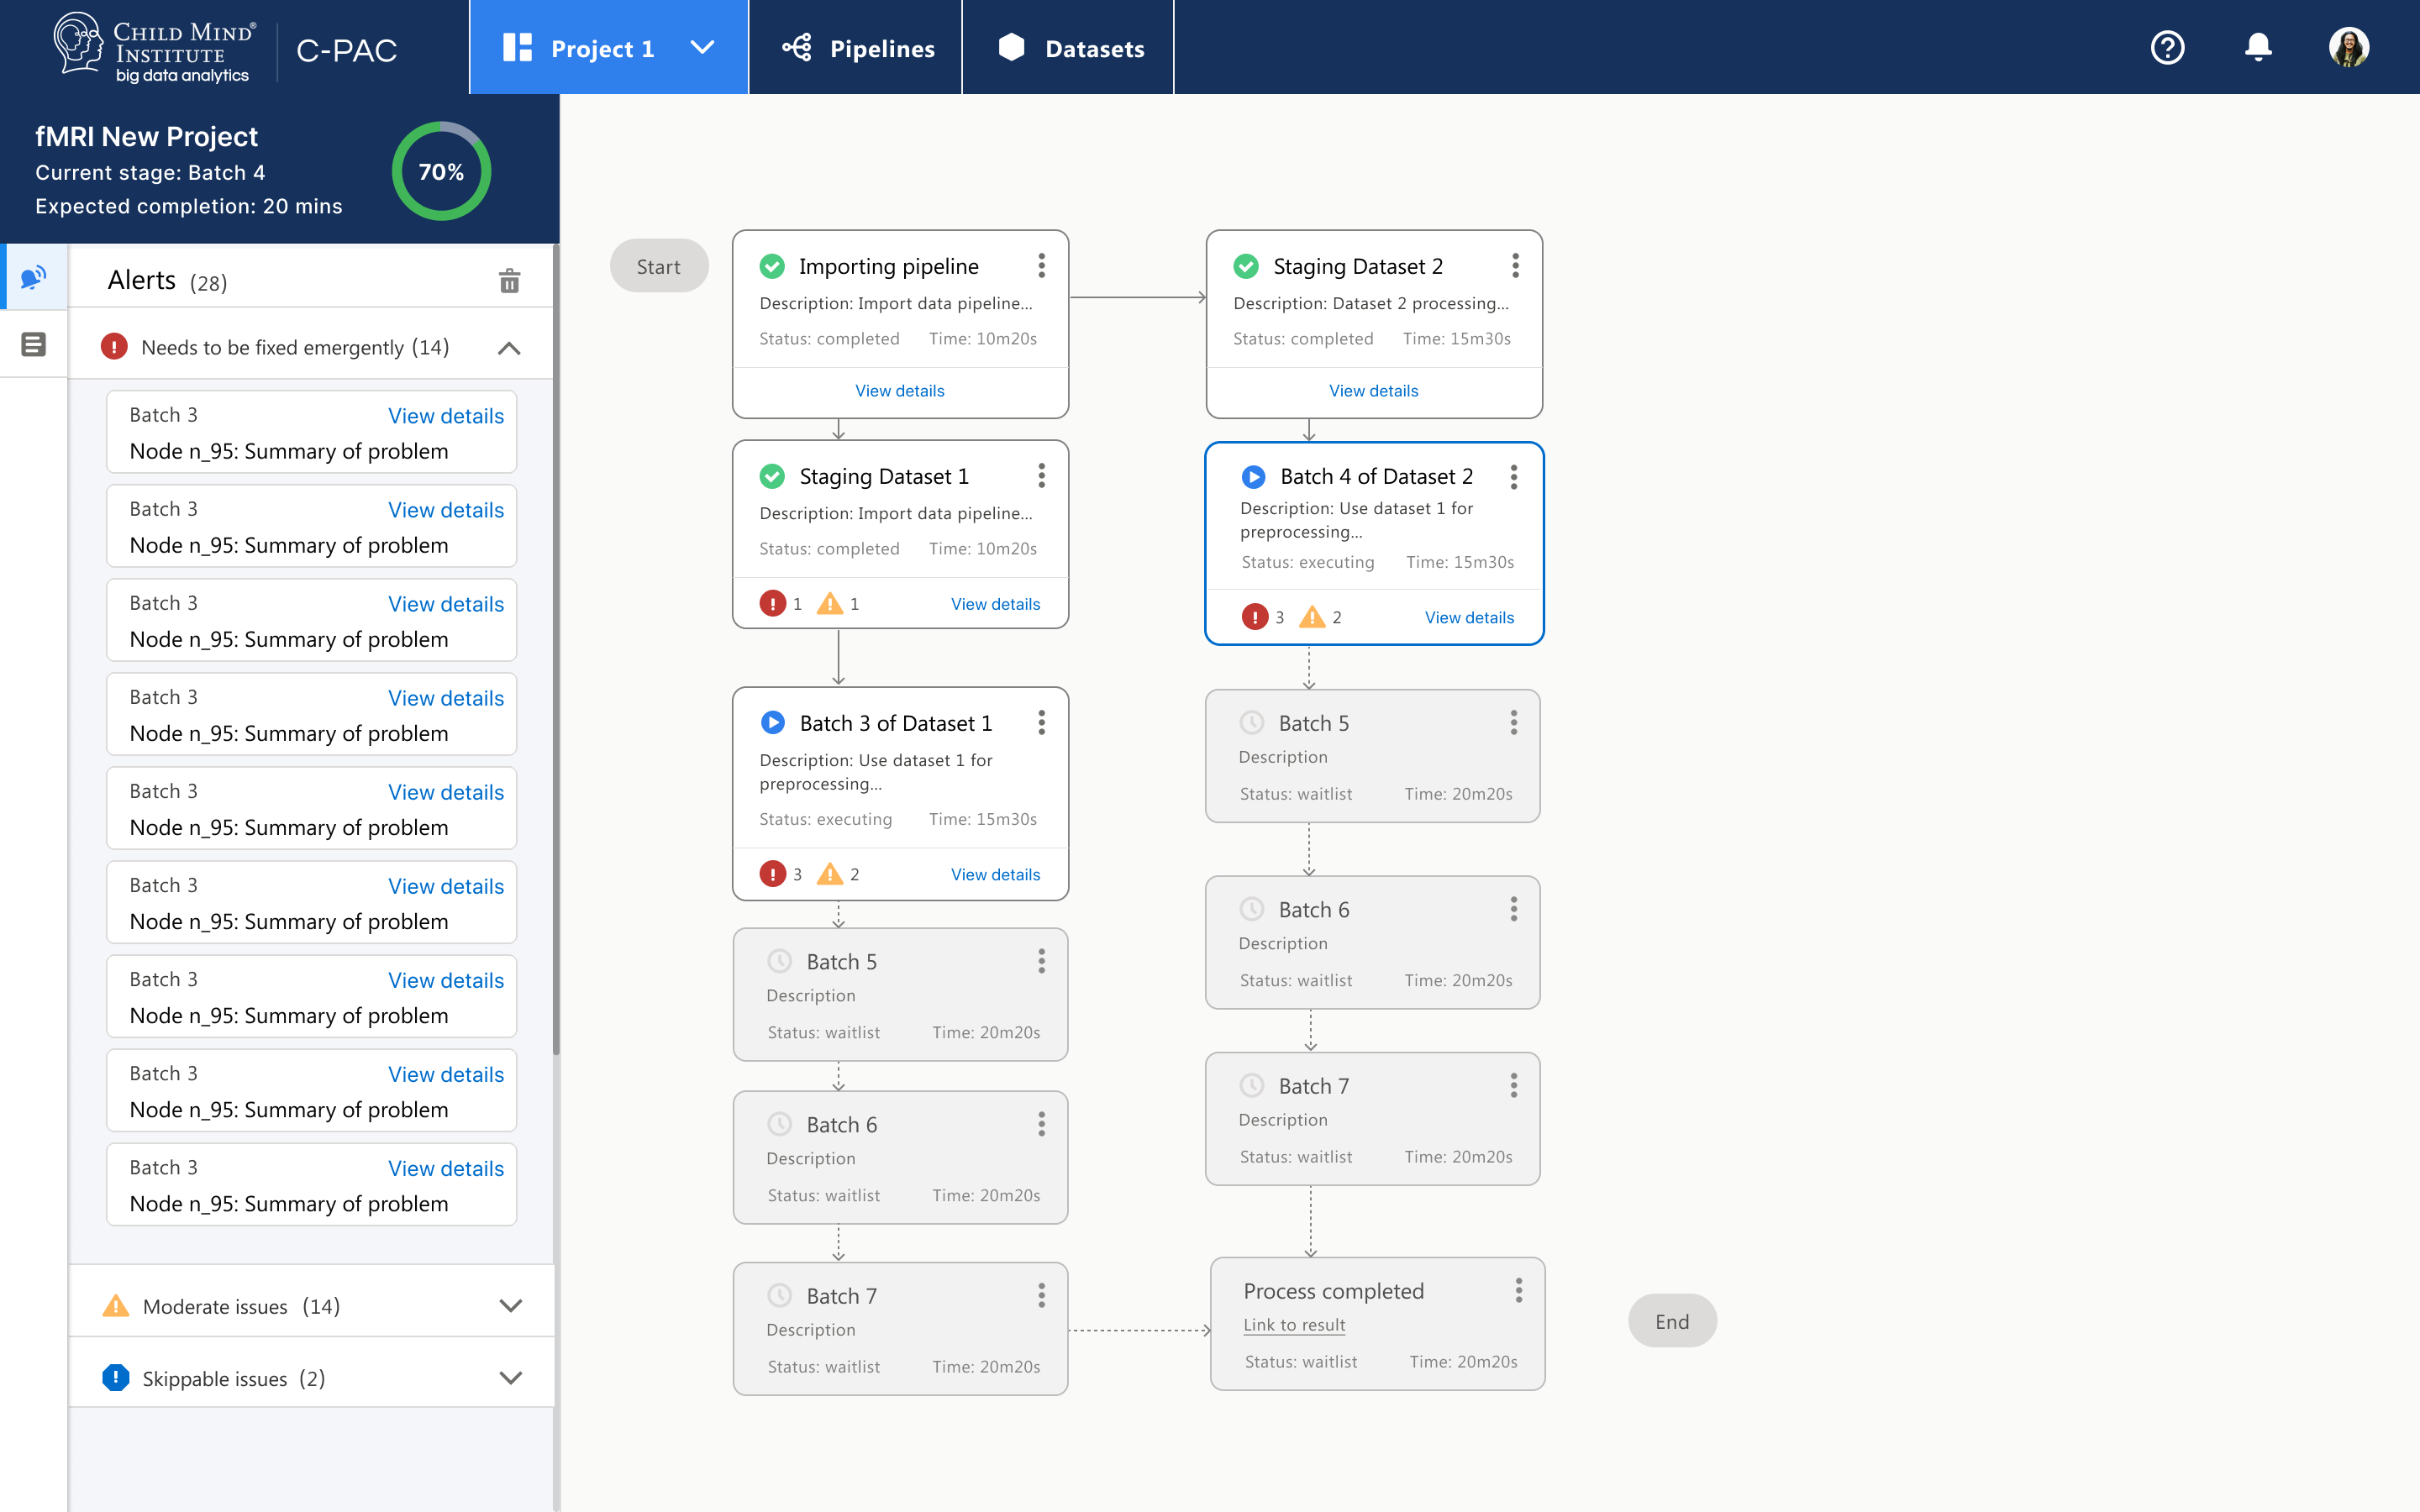
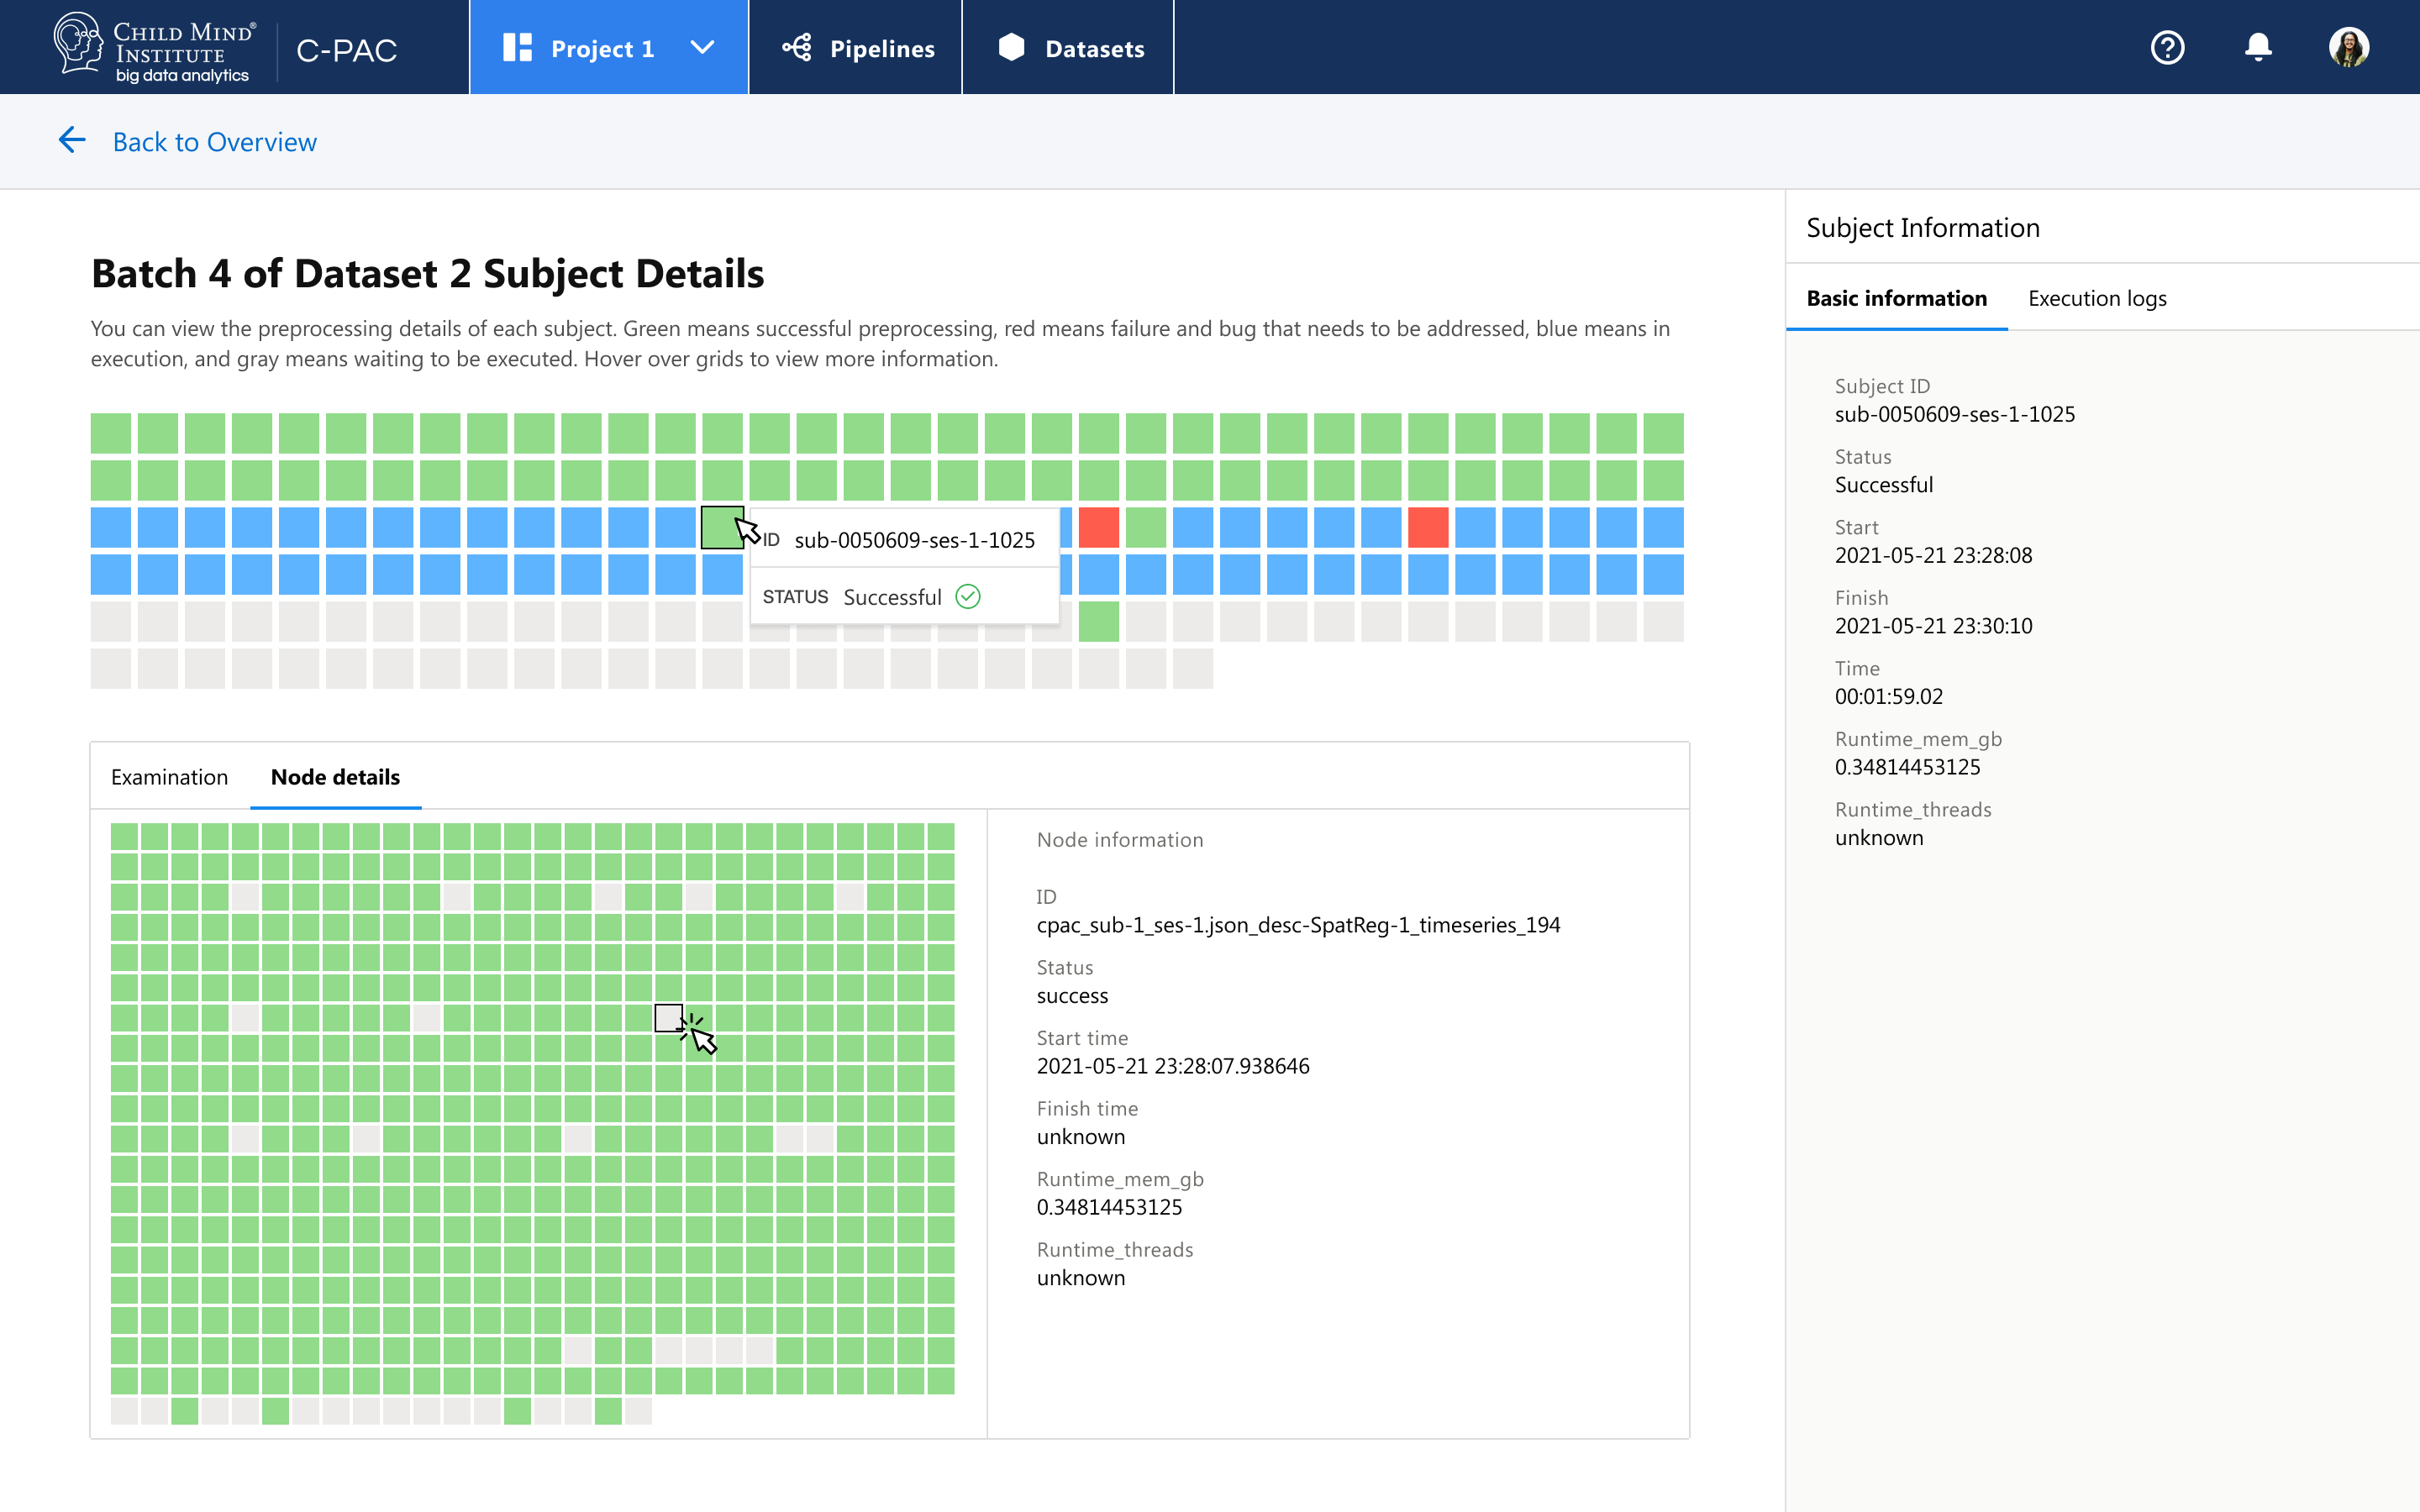
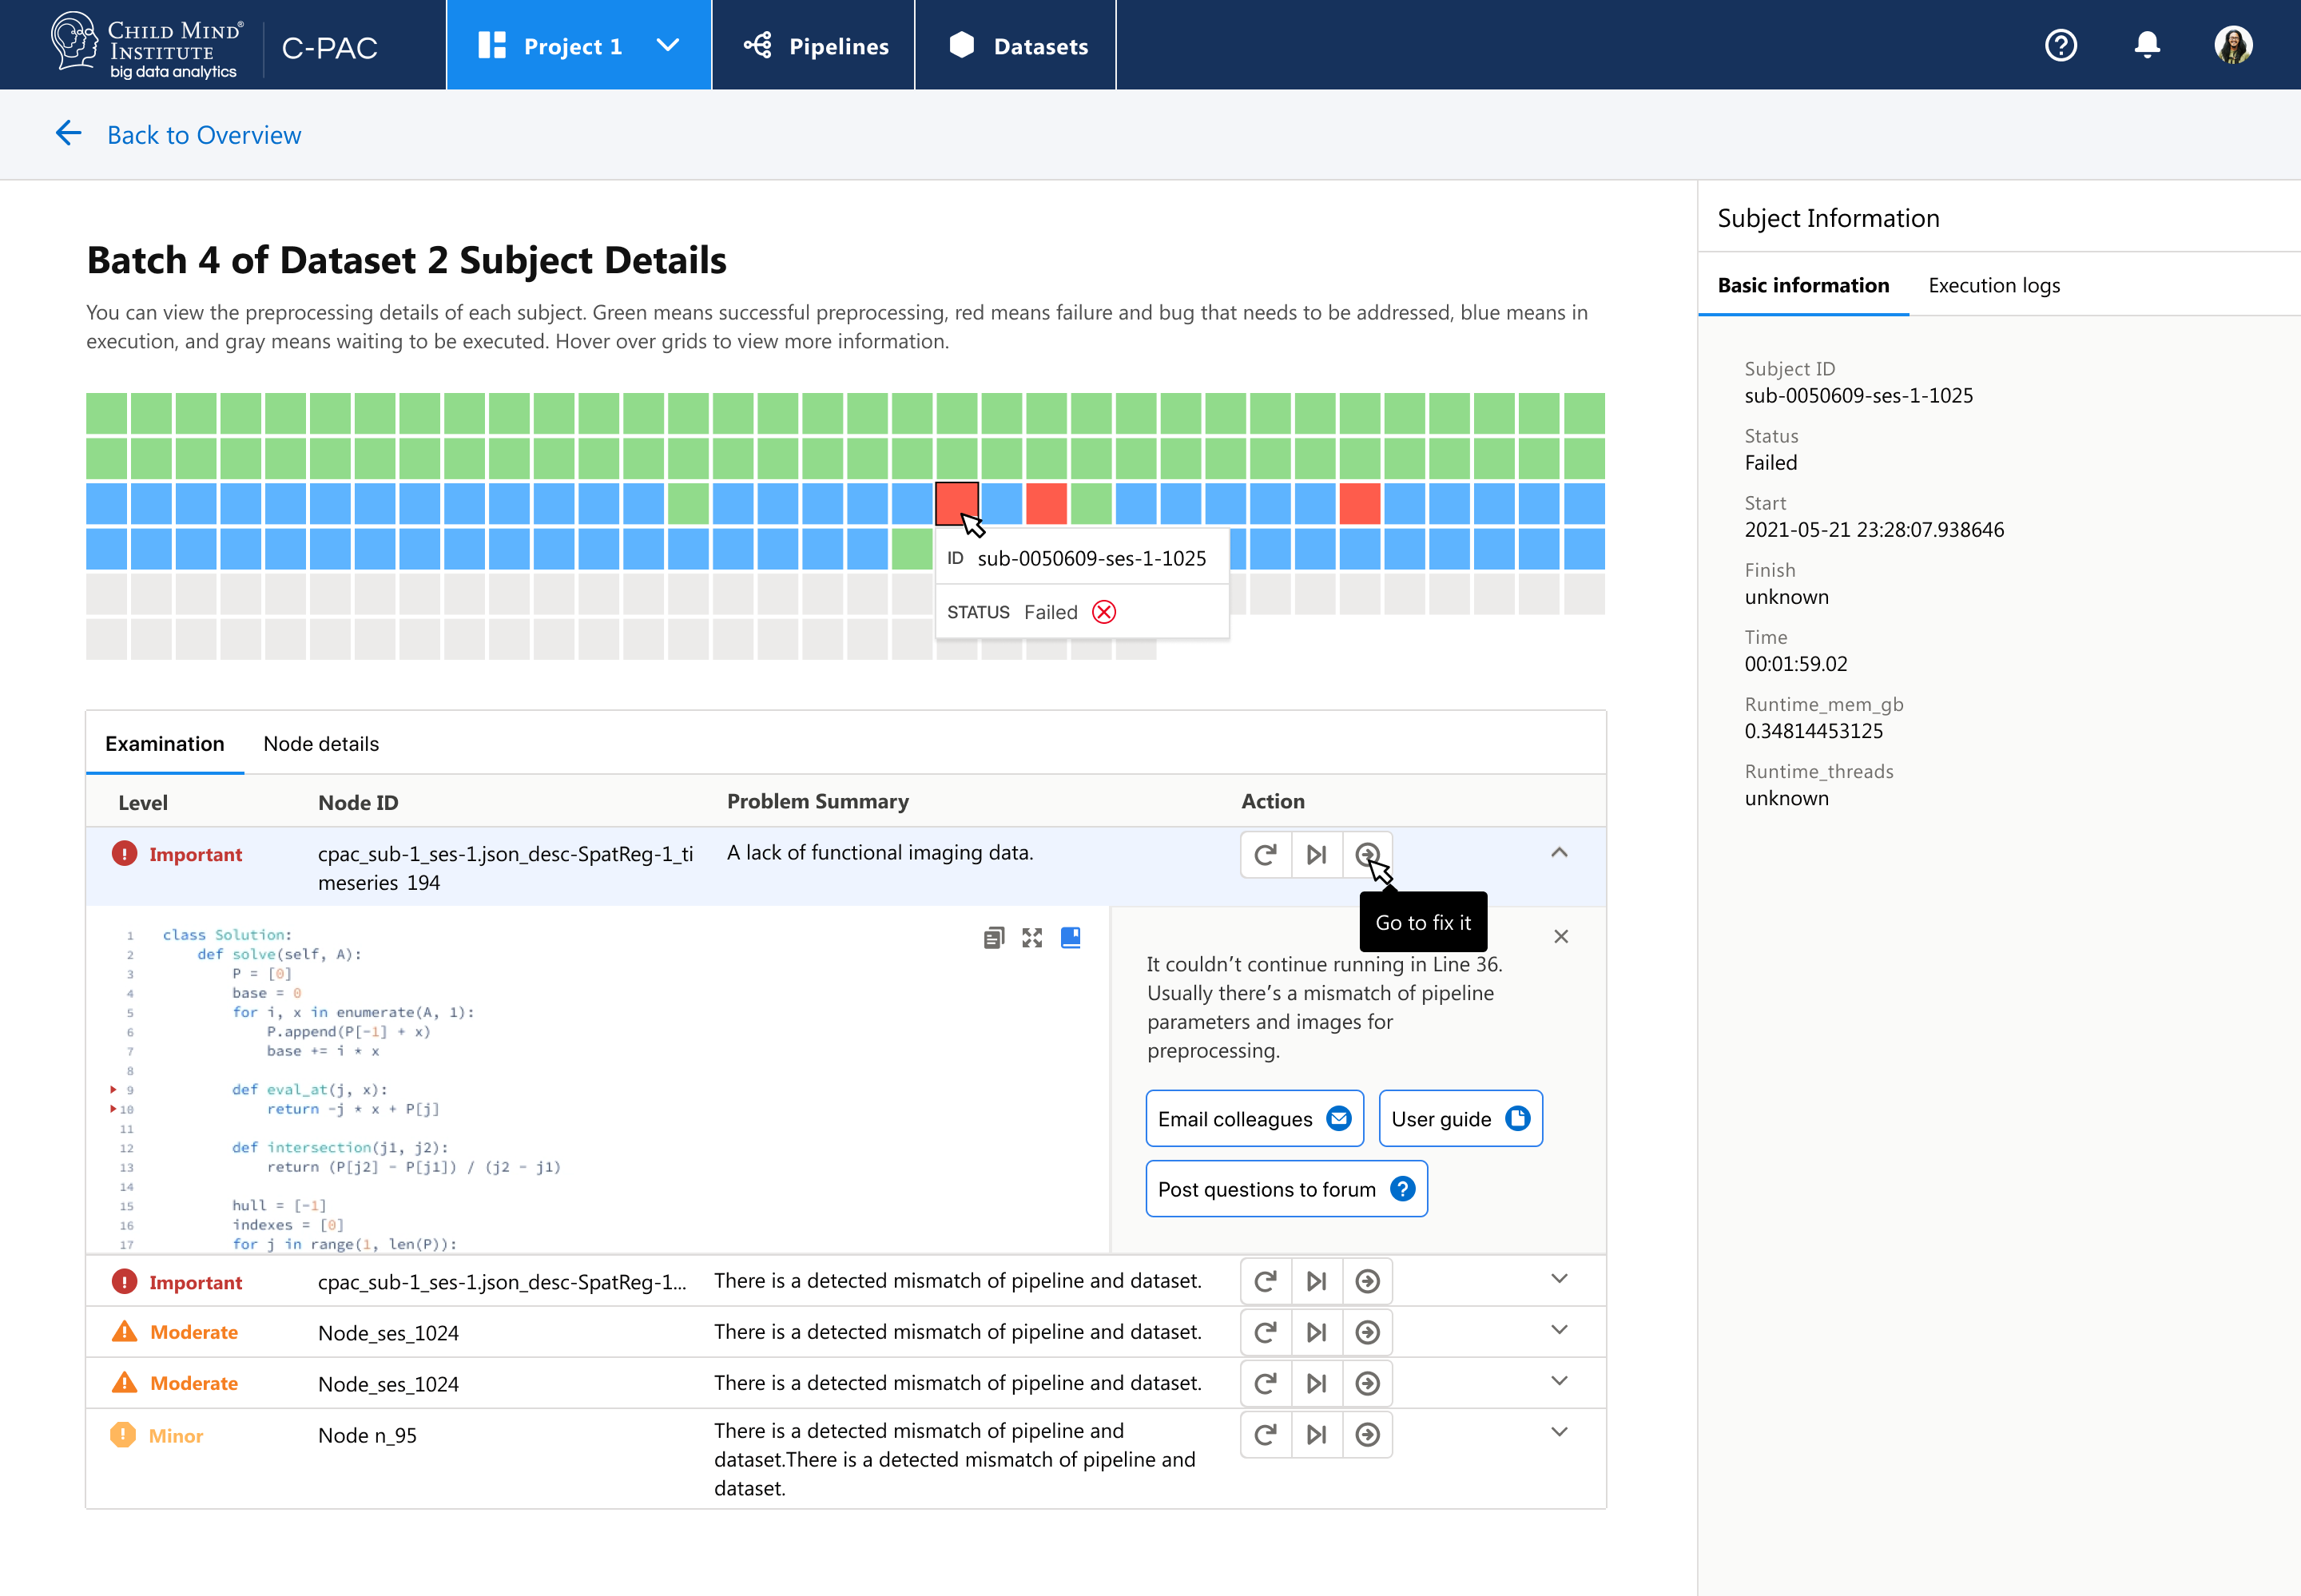
How CPAC Works

As illustrated in the image below, CPAC will provide an easy and intuitive interface for novice and expert users to configure their pipeline, and process brain activity images into data that could be further used for machine learning training.

Illustrations to visualize the flow for data processing

Key User Interview Insights

Design Goals

Delivery highlights

Reconfigure the information architecture

The landing page provides users clear and efficient accesses to managing their projects of data processing - main jobs-to-be-done, managing pipelines, and managing Datasets. The new GUI is an integrated dashboard that helps neuroscientists quickly start new data processing tasks and view progresses of tasks in process.

Landing page of C-PAC

Wizard to help build up pipelines

To help students (the Learner) learn how to use the platform and best practices to process images, we use wizard to assist users to build up pipelines and apply datasets.

Wizard to create pipelines and process data

Customize and share Pipelines

Saved and shared pipelines and datasets could assist users to quickly deploy and process images.

The interface when users zoom into a certain period of time

Domentation

Provide inline documentation to assist users trouble shoot and finish their tasks.

Interface for customizing chart colors

Preview data to be processed

When users are creating dataset for their jobs, they could take a preview of selected data, to avoid selecting images that failed to meet the requirement.

Interface for customizing chart colors

Visualize Processing

Users are able to view the processing and have a clear view of the progress on the landing page. A transparent process and timelines help users better value the time of wait and visualize whether any parts of the processing caused the failure of the overall project.

Interface for customizing chart colors

Visualize Processing

On detail page, the users could have a great knowledge of which node is crashed and understand the progress. They are able to check time stamps and logs about each node.

Interface for customizing chart colors

Reduce trouble shooting time

Users are able to view a list of problems and focus on the most severe problems based on C-PAC ranking of problems. It will redirect users to fix where things crashed and provide users quick links to seek help from community and their team.

Interface for customizing chart colors

More Stories Behind the Scene...

Get in touch for more details 📭

back to top button icon